Ripples Learning · Web app
Ripples Velocity
Showing whether training actually changes the way people work.
- My role
- UX designer (research & design)
- Timeline
- TBC
- Platform
- Web app
- Team
- Product, engineering, business stakeholders
- Tools
- Figma, FigJam
Velocity keeps a training programme going for 90 days after it ends. Learners log short stories about using a new skill at work, and their managers and peers back them up. I designed the dashboards that turn those stories into clear signals and a next step, for everyone from the individual learner to the L&D manager.
7
role-based views, from individual learner to CEO
90 days
of on-the-job follow-through tracked after each programme
3
suggested next moves on every view, each with its reason
- The problem
- Companies invest in training but rarely know if it changes how people work. Completion rates and feedback forms stop at the classroom door.
- The product
- Velocity follows each programme for 90 days. Learners write short “stories” about using a skill at work, and managers and peers acknowledge them.
- My job
- Design dashboards that turn those stories into signals anyone can read in seconds, and end every view with a clear next step.
- Shown here
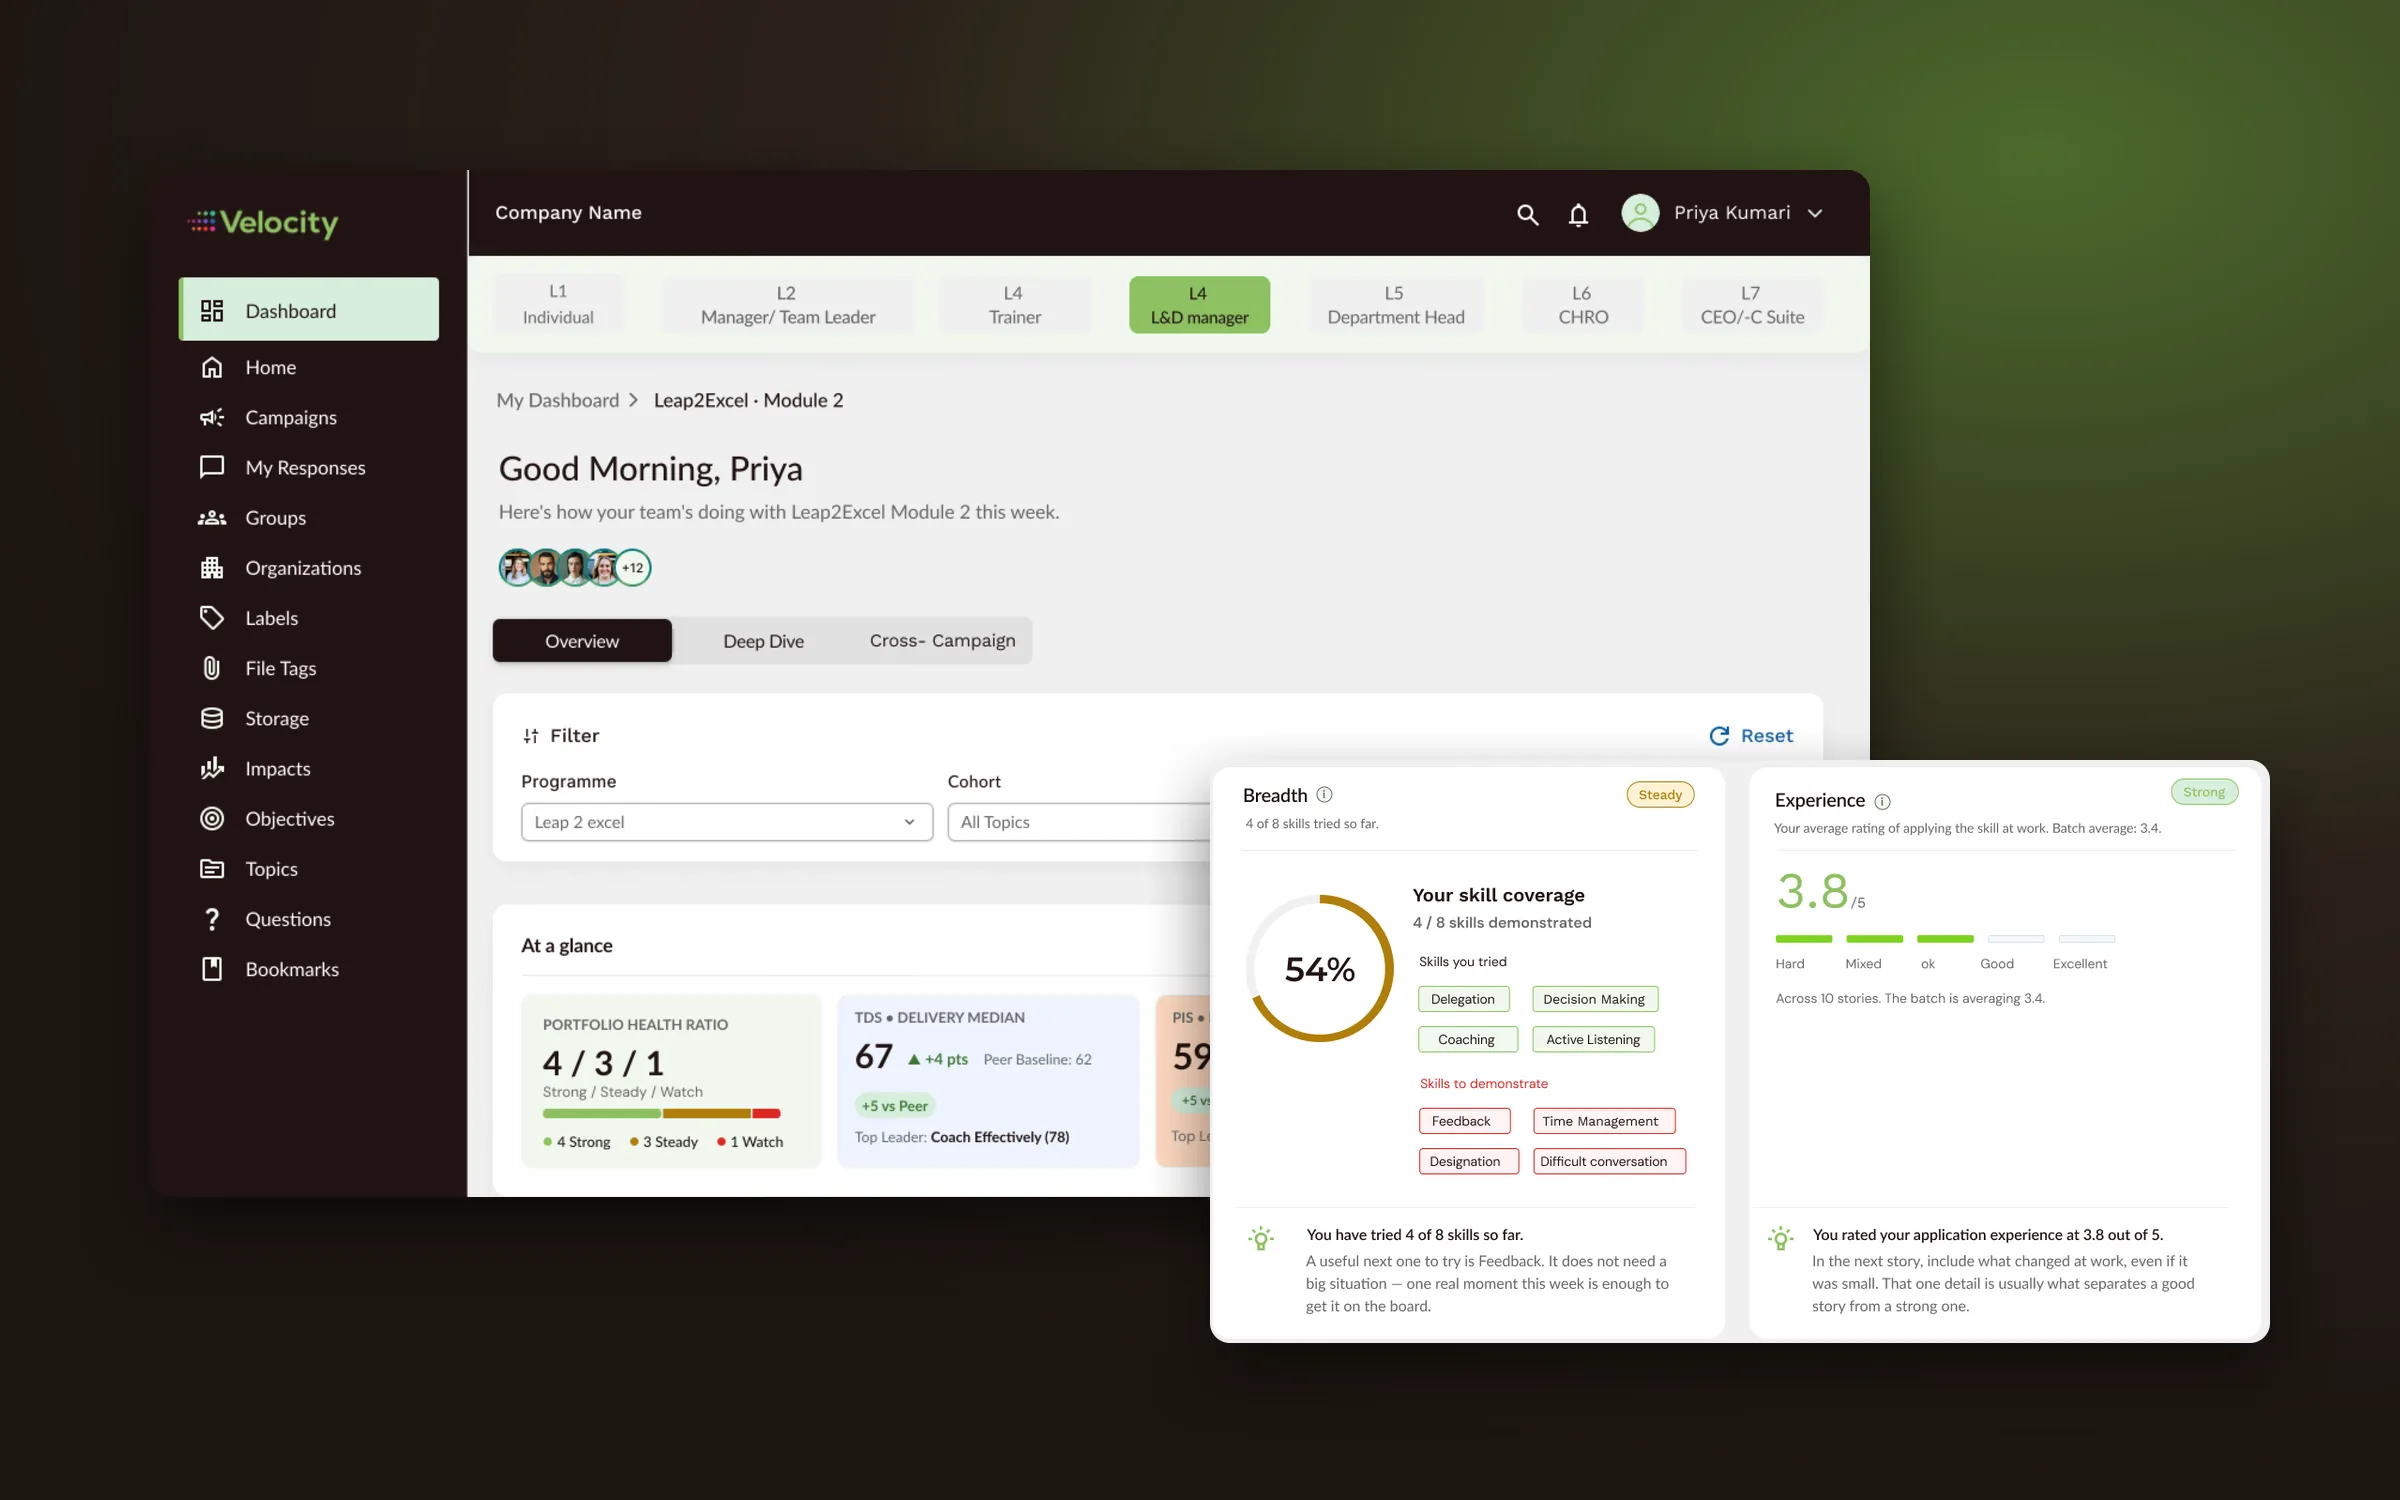
- Four high-fidelity screens: three for the individual learner (L1) and one for the L&D manager (L4).
The challenge
Most training ends with a certificate and a feedback form. Neither tells anyone whether people used what they learned. Velocity closes that gap by asking learners to write a short story each time they apply a skill at work, then asking their manager and peers to confirm it.
That creates a new problem. Ten stories, a dozen ratings and a pile of acknowledgements is just more data. If the dashboards only reported numbers, learners would stop writing and managers would stop looking.
So the design question became:
How might we turn a stream of personal stories into something each person can understand in seconds and act on this week, without making learners feel graded?
One product, seven points of view
Everyone in the organisation is looking at the same stories, but each person asks a different question. A learner wants to know whether they’re improving. An L&D manager wants to know which programmes are worth running again. Velocity gives every level its own view, switched from a single bar at the top of the screen.
- L1 Individual (shown in this case study)
- L2 Manager / Team lead
- L3 Trainer
- L4 L&D manager (shown in this case study)
- L5 Department head
- L6 CHRO
- L7 CEO / C-suite
“Am I actually using what I learned, and what should I try next?”
“Which programmes are changing behaviour, and what should I do about the ones that aren’t?”
Explore the screens
Pick a view, then scroll inside the frame to see the full screen.
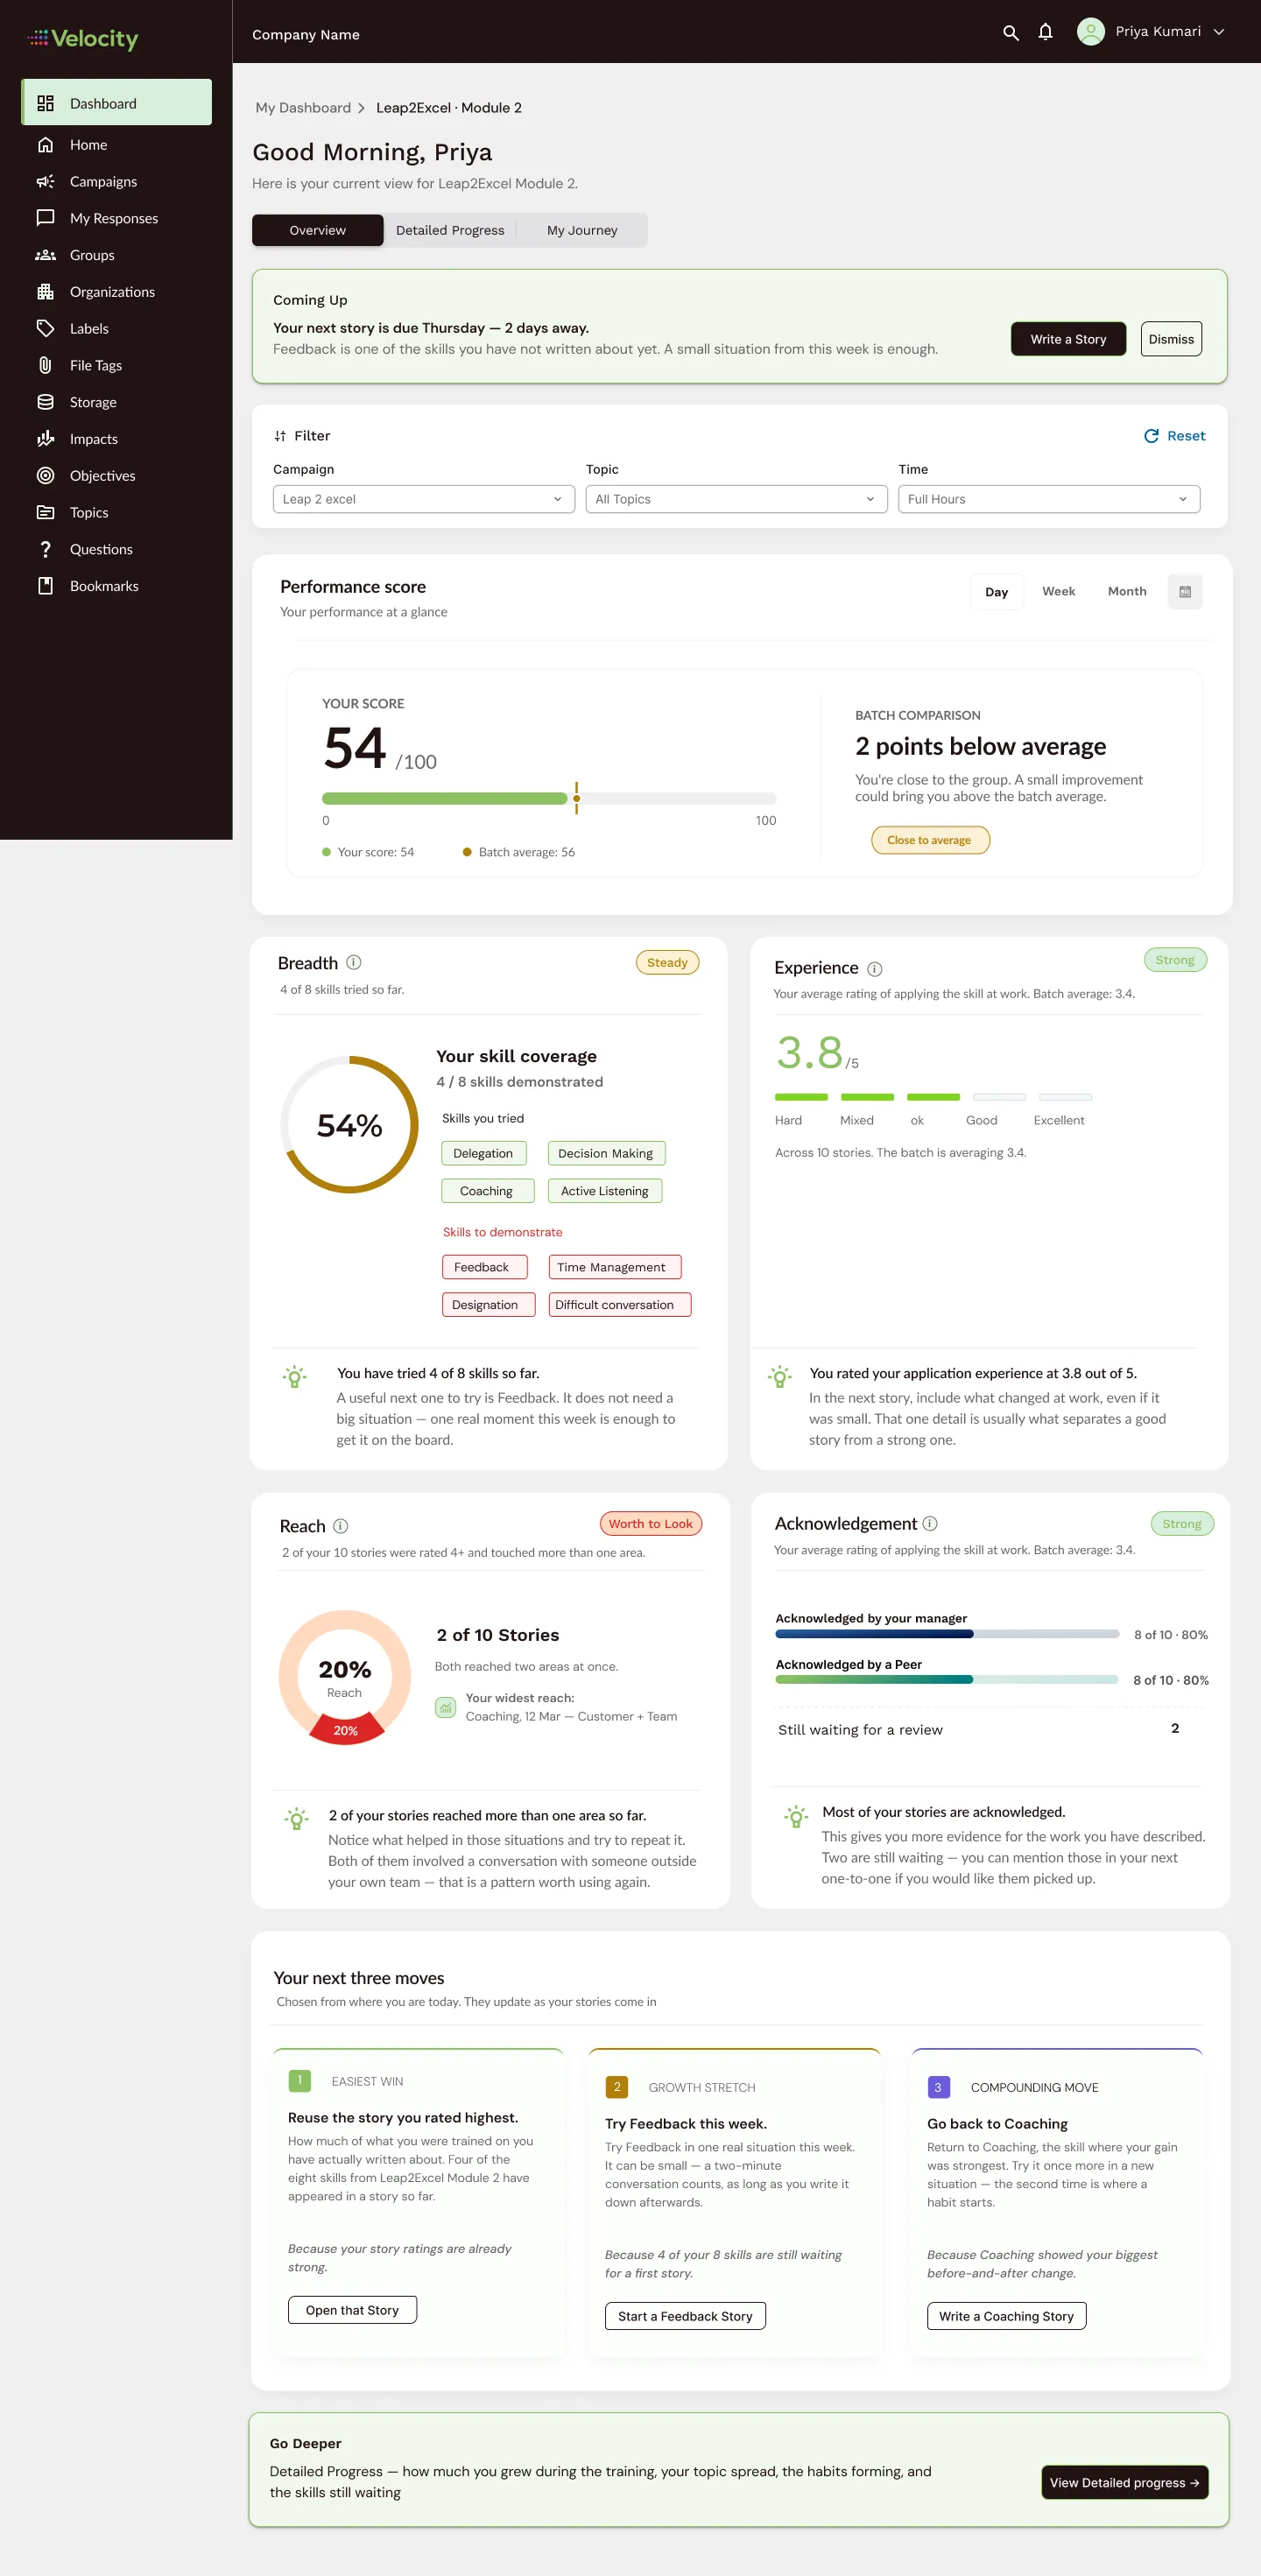
Learner · L1
Overview
“Where am I right now?”
What to look for
- A reminder of the next story due, with the one skill not yet written about
- Your score against the batch average, framed as “close”, not “behind”
- Four cards (Breadth, Experience, Reach, Acknowledgement), each ending in a plain-language insight
- Three suggested next moves, each with its reason
Names and figures are sample data.
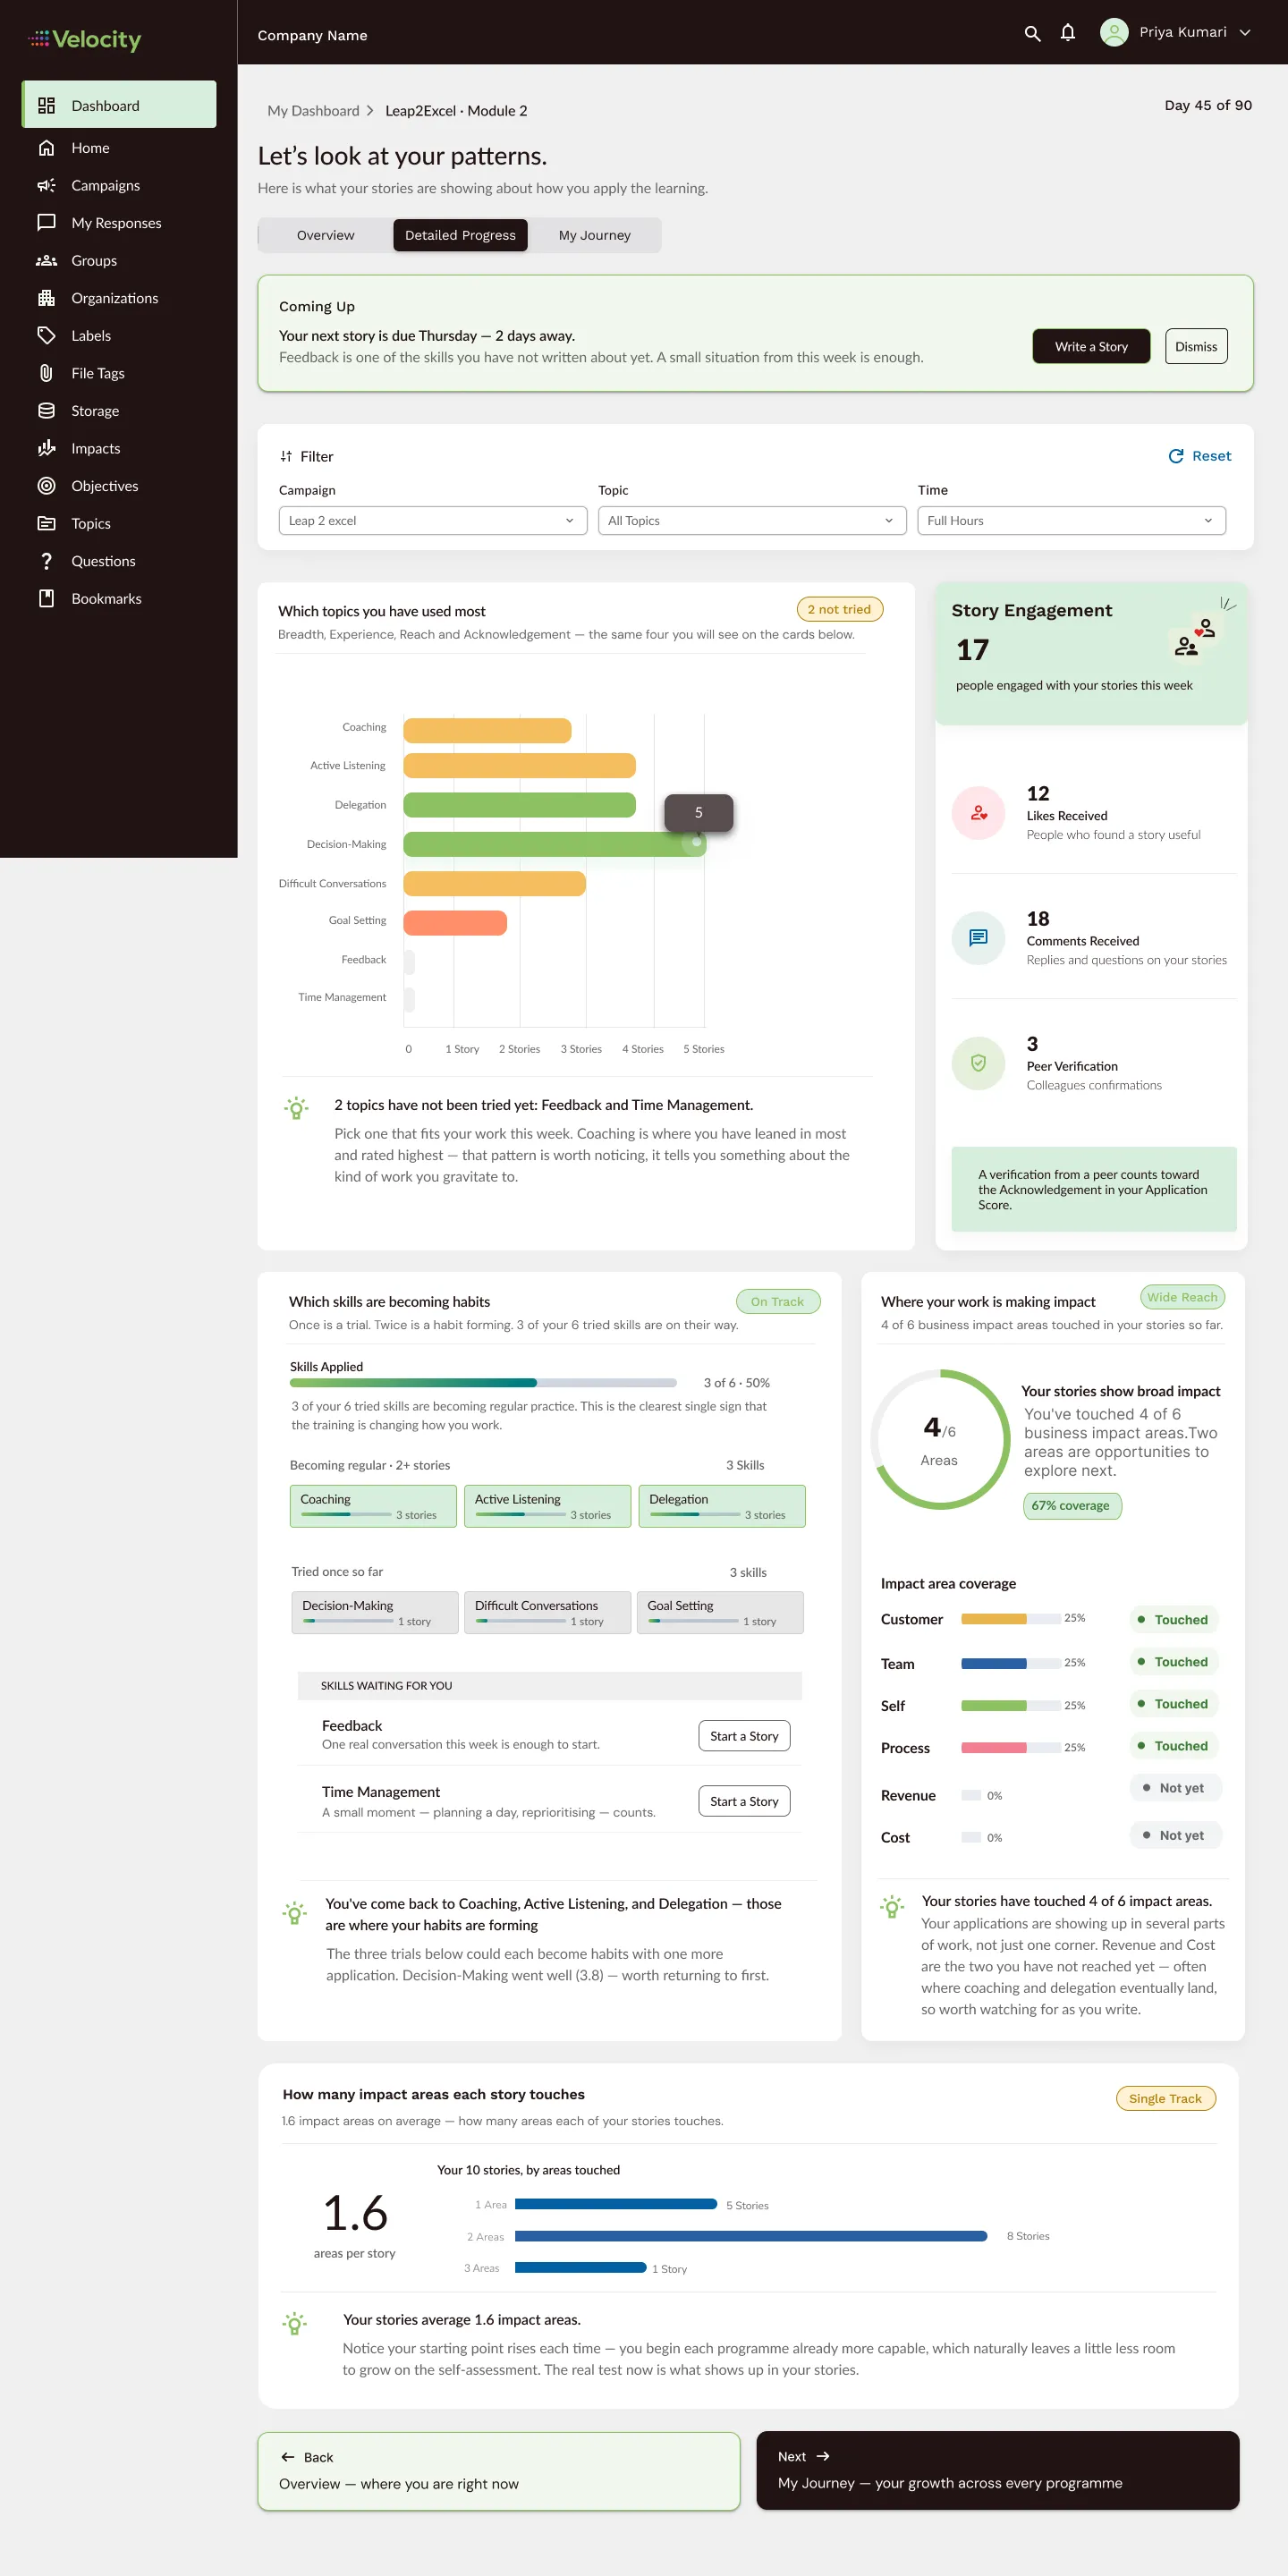
Learner · L1
Detailed progress
“How am I applying the learning?”
What to look for
- Which topics you’ve written about most, and the two you haven’t tried yet
- Which skills are turning into habits: “once is a trial, twice is a habit forming”
- Where your stories make an impact across six business areas, with “Not yet” instead of zero
Names and figures are sample data.
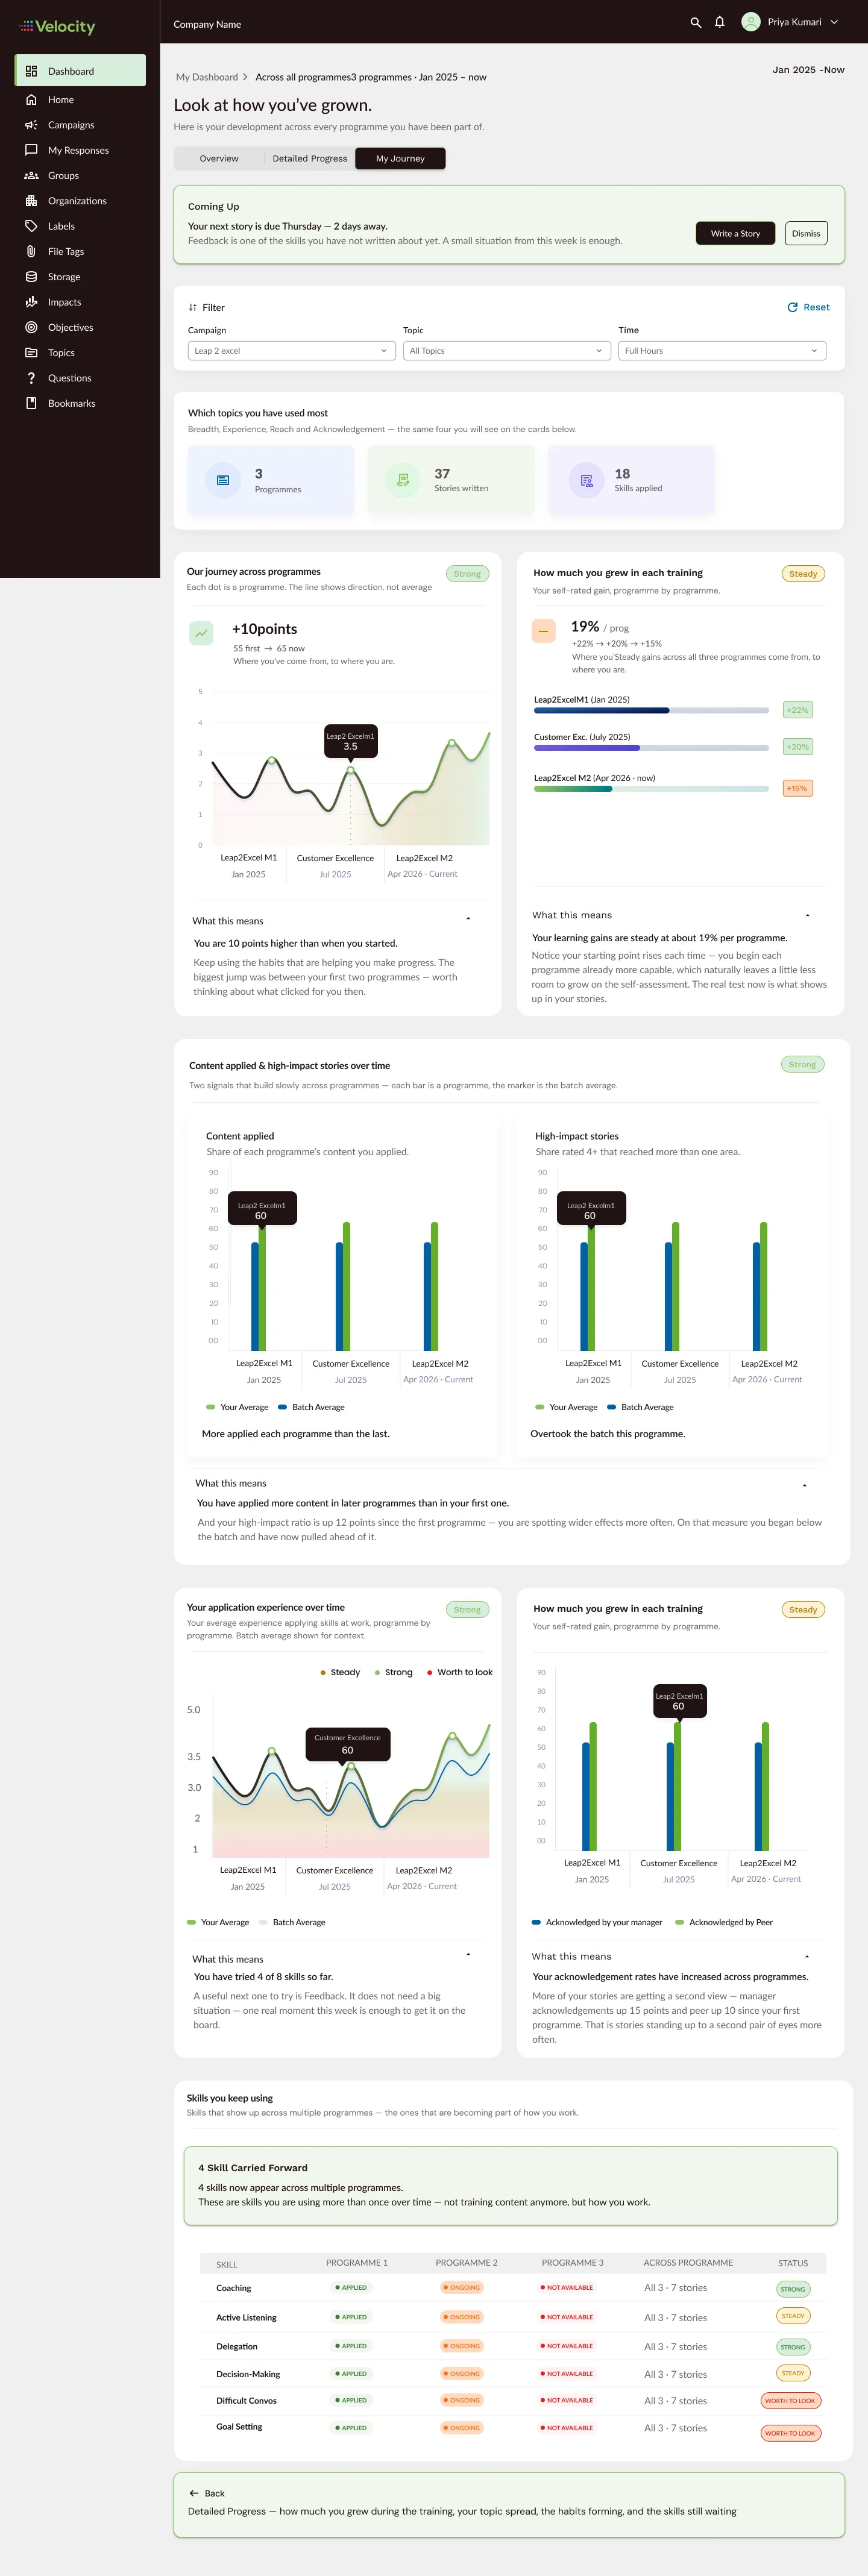
Learner · L1
My journey
“How have I grown across every programme?”
What to look for
- Your growth across three programmes since January 2025
- “What this means” under every chart, in one or two sentences
- Skills carried forward: the ones becoming part of how you work
Names and figures are sample data.
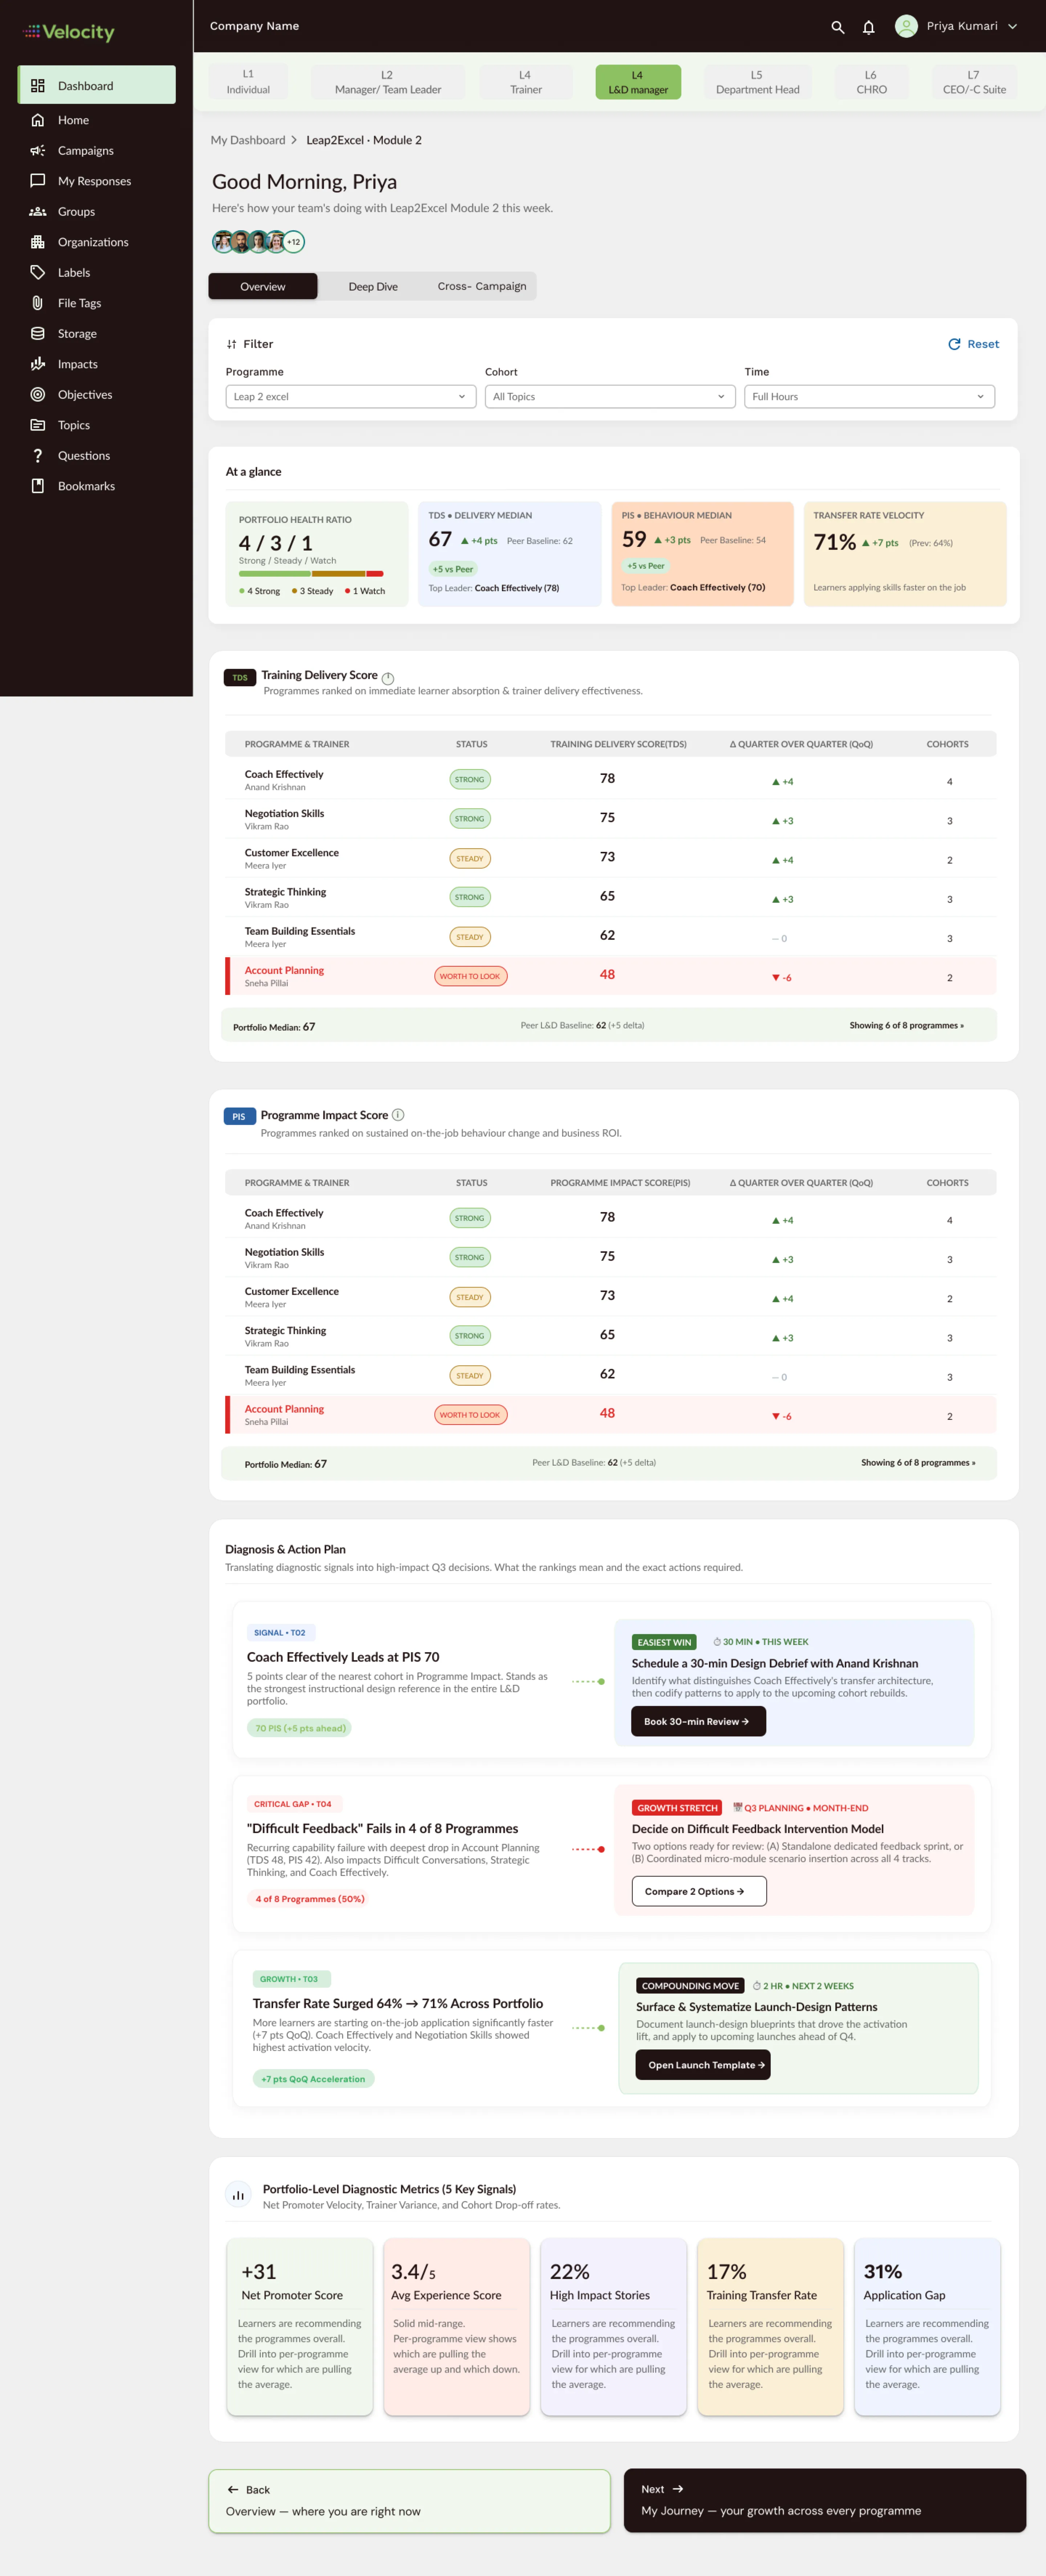
L&D manager · L4
Overview
“Which programmes are working, and what do I do next?”
What to look for
- Four headline signals at a glance, each compared with a peer baseline
- Programmes ranked twice: on how well training was delivered (TDS) and on real behaviour change (PIS)
- A diagnosis and action plan that links every signal to a concrete decision
Names and figures are sample data.
Five design decisions
Decision 01: Every number comes with a sentence
Why: A score on its own raises a question. A score with a sentence answers it.
Every card in Velocity follows the same anatomy, so once you’ve read one, you can read them all. Hover or tap the numbers to see how the Breadth card is put together.
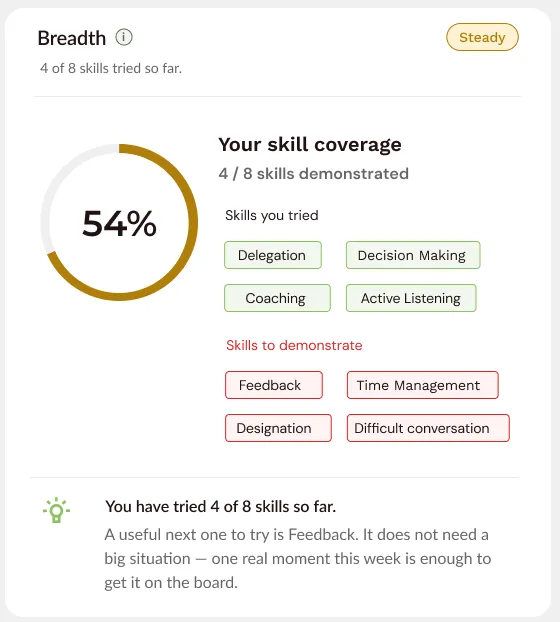
- 1
A plain name, with the definition one tap away
“Breadth” is everyday language. The ⓘ explains it, and the line below says what is being counted: 4 of 8 skills tried so far.
- 2
Status in a word
Strong, Steady, or a flag to look closer. A word, not just a colour, so it reads clearly for everyone.
- 3
One headline number
The ring shows progress at a glance; the figure inside gives the exact value.
- 4
What’s done, and what’s next
Skills already tried sit above the ones still waiting, so the gap reads like a to-do list rather than a failure.
- 5
What it means, and one small step
A short reading of the number in plain words, ending with an action small enough to do this week.
Decision 02: Translate the jargon, and lead with what changed
Why: L&D managers juggle acronyms all day. The dashboard should explain them, not add more.
The manager view ranks programmes twice: once on how well the training was delivered, and once on whether behaviour actually changed. A programme can do well on the first and still fail on the second, and that difference is the insight. Each metric is spelled out, given a one-line description, and compared with a baseline, so a number like 67 always means something.
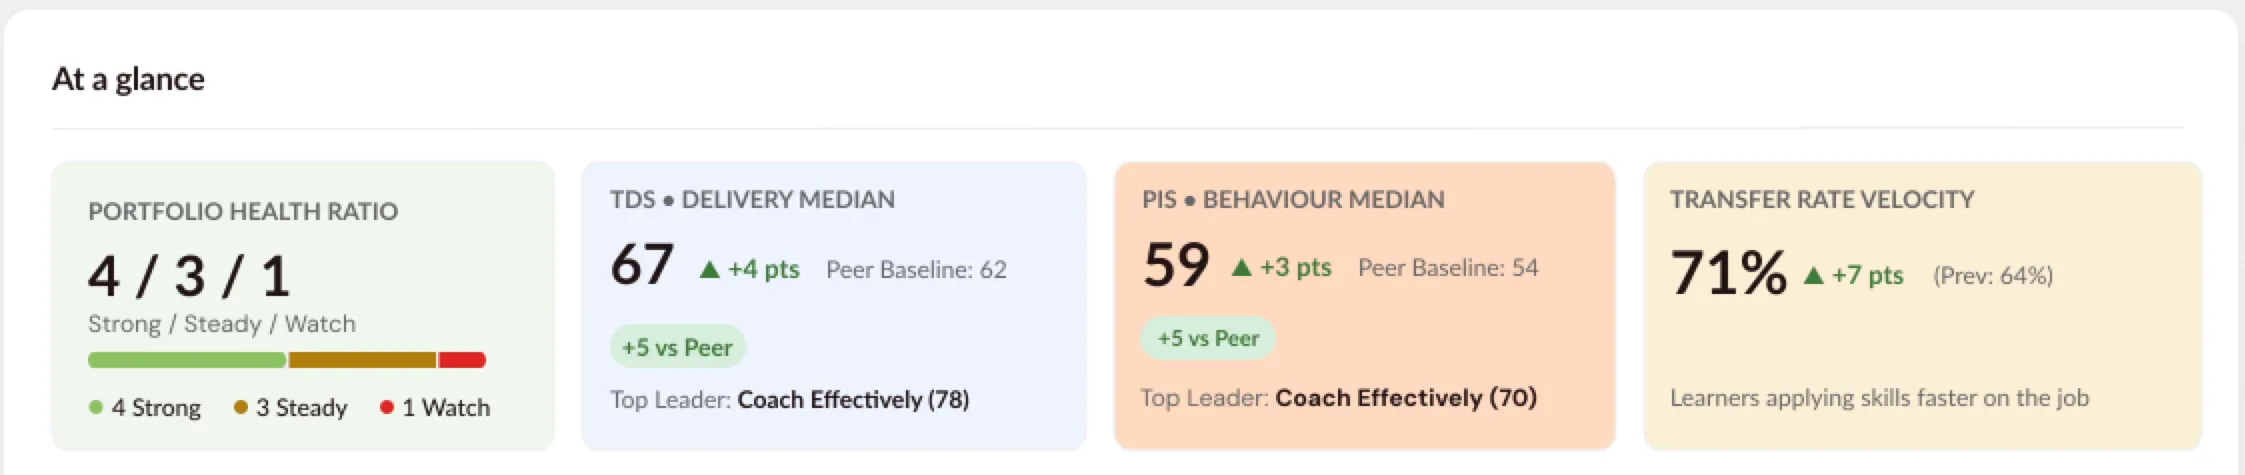
- TDSTraining Delivery Score
“Did the training land?”
Ranks programmes on how much learners absorbed straight away and how well the trainer delivered it.
On screen: Median 67, ▲ +4 pts, peer baseline 62
- PISProgramme Impact Score
“Did people actually change how they work?”
Ranks programmes on lasting behaviour change on the job and business return.
On screen: Median 59, ▲ +3 pts, peer baseline 54
- RateTransfer rate velocity
“How quickly are people putting it into practice?”
The share of learners applying their skills on the job, and how fast it is moving.
On screen: 71%, up from 64% last quarter
- RatioPortfolio health
“How many programmes need my attention?”
Every programme counted as Strong, Steady or Watch, as a number and a single stacked bar.
On screen: 4 / 3 / 1
In the ranked tables, calm is the default and only the exception stands out:
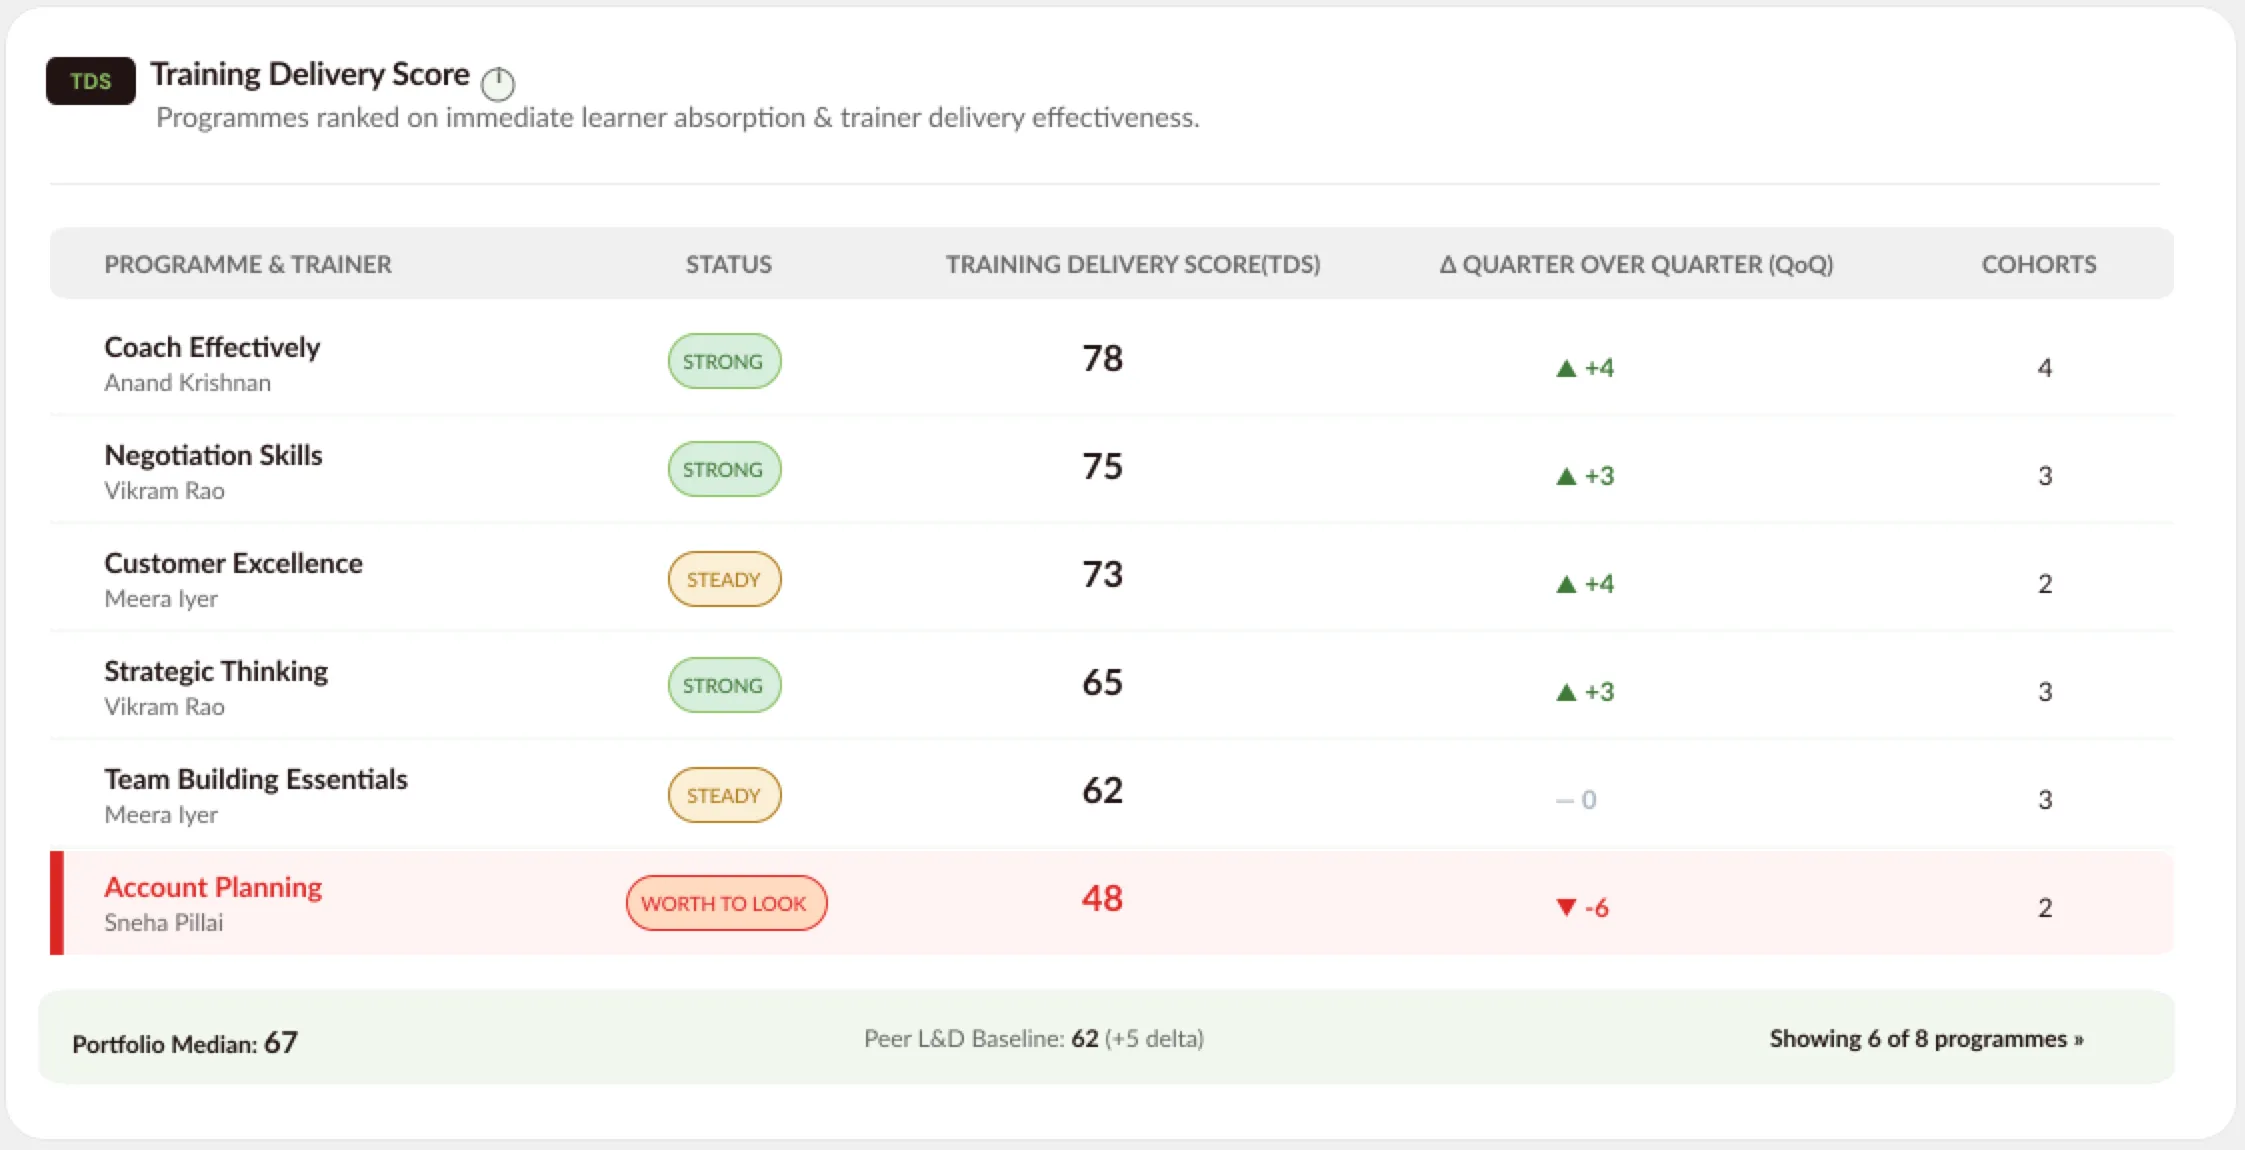
- 1
Acronym, then plain English
TDS is spelled out and described in one line: what it ranks, and on what basis.
- 2
Status in words, not blame
A neutral flag to look closer instead of “failing”. It points at a programme without passing judgement on the trainer.
- 3
Direction, not just position
Arrows show the change since last quarter. A good score that’s slipping matters as much as a low one.
- 4
Only the exception is loud
The one programme that dropped gets a red bar and tint. Everything else stays quiet, so your eye goes straight to it.
- 5
Always a point of comparison
Every table ends with the portfolio median and an outside peer baseline.
Decision 03: End every view with a next step, and say why
Why: A dashboard that stops at a number leaves people asking “so what?”.
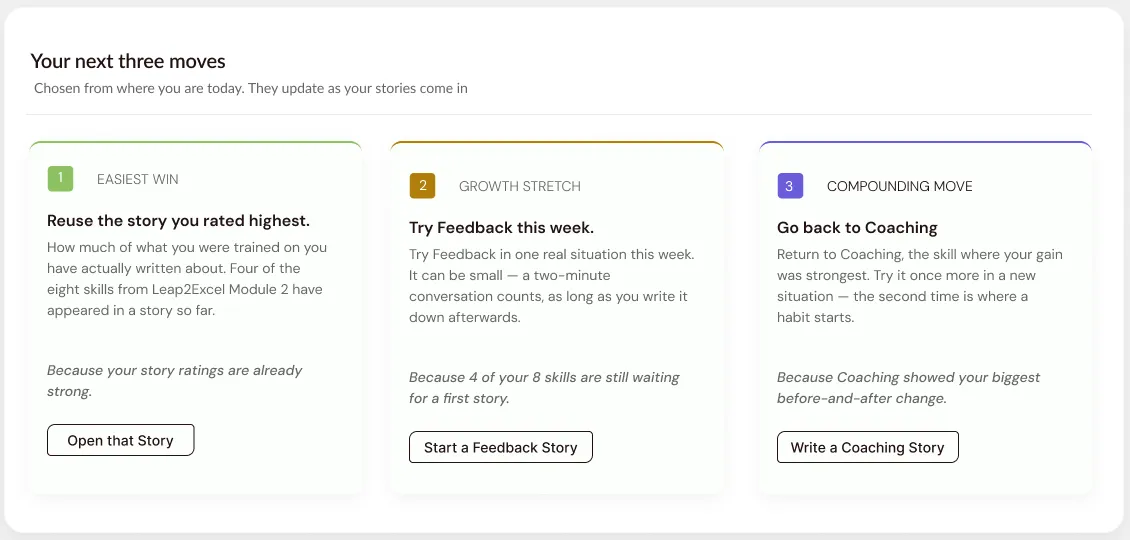
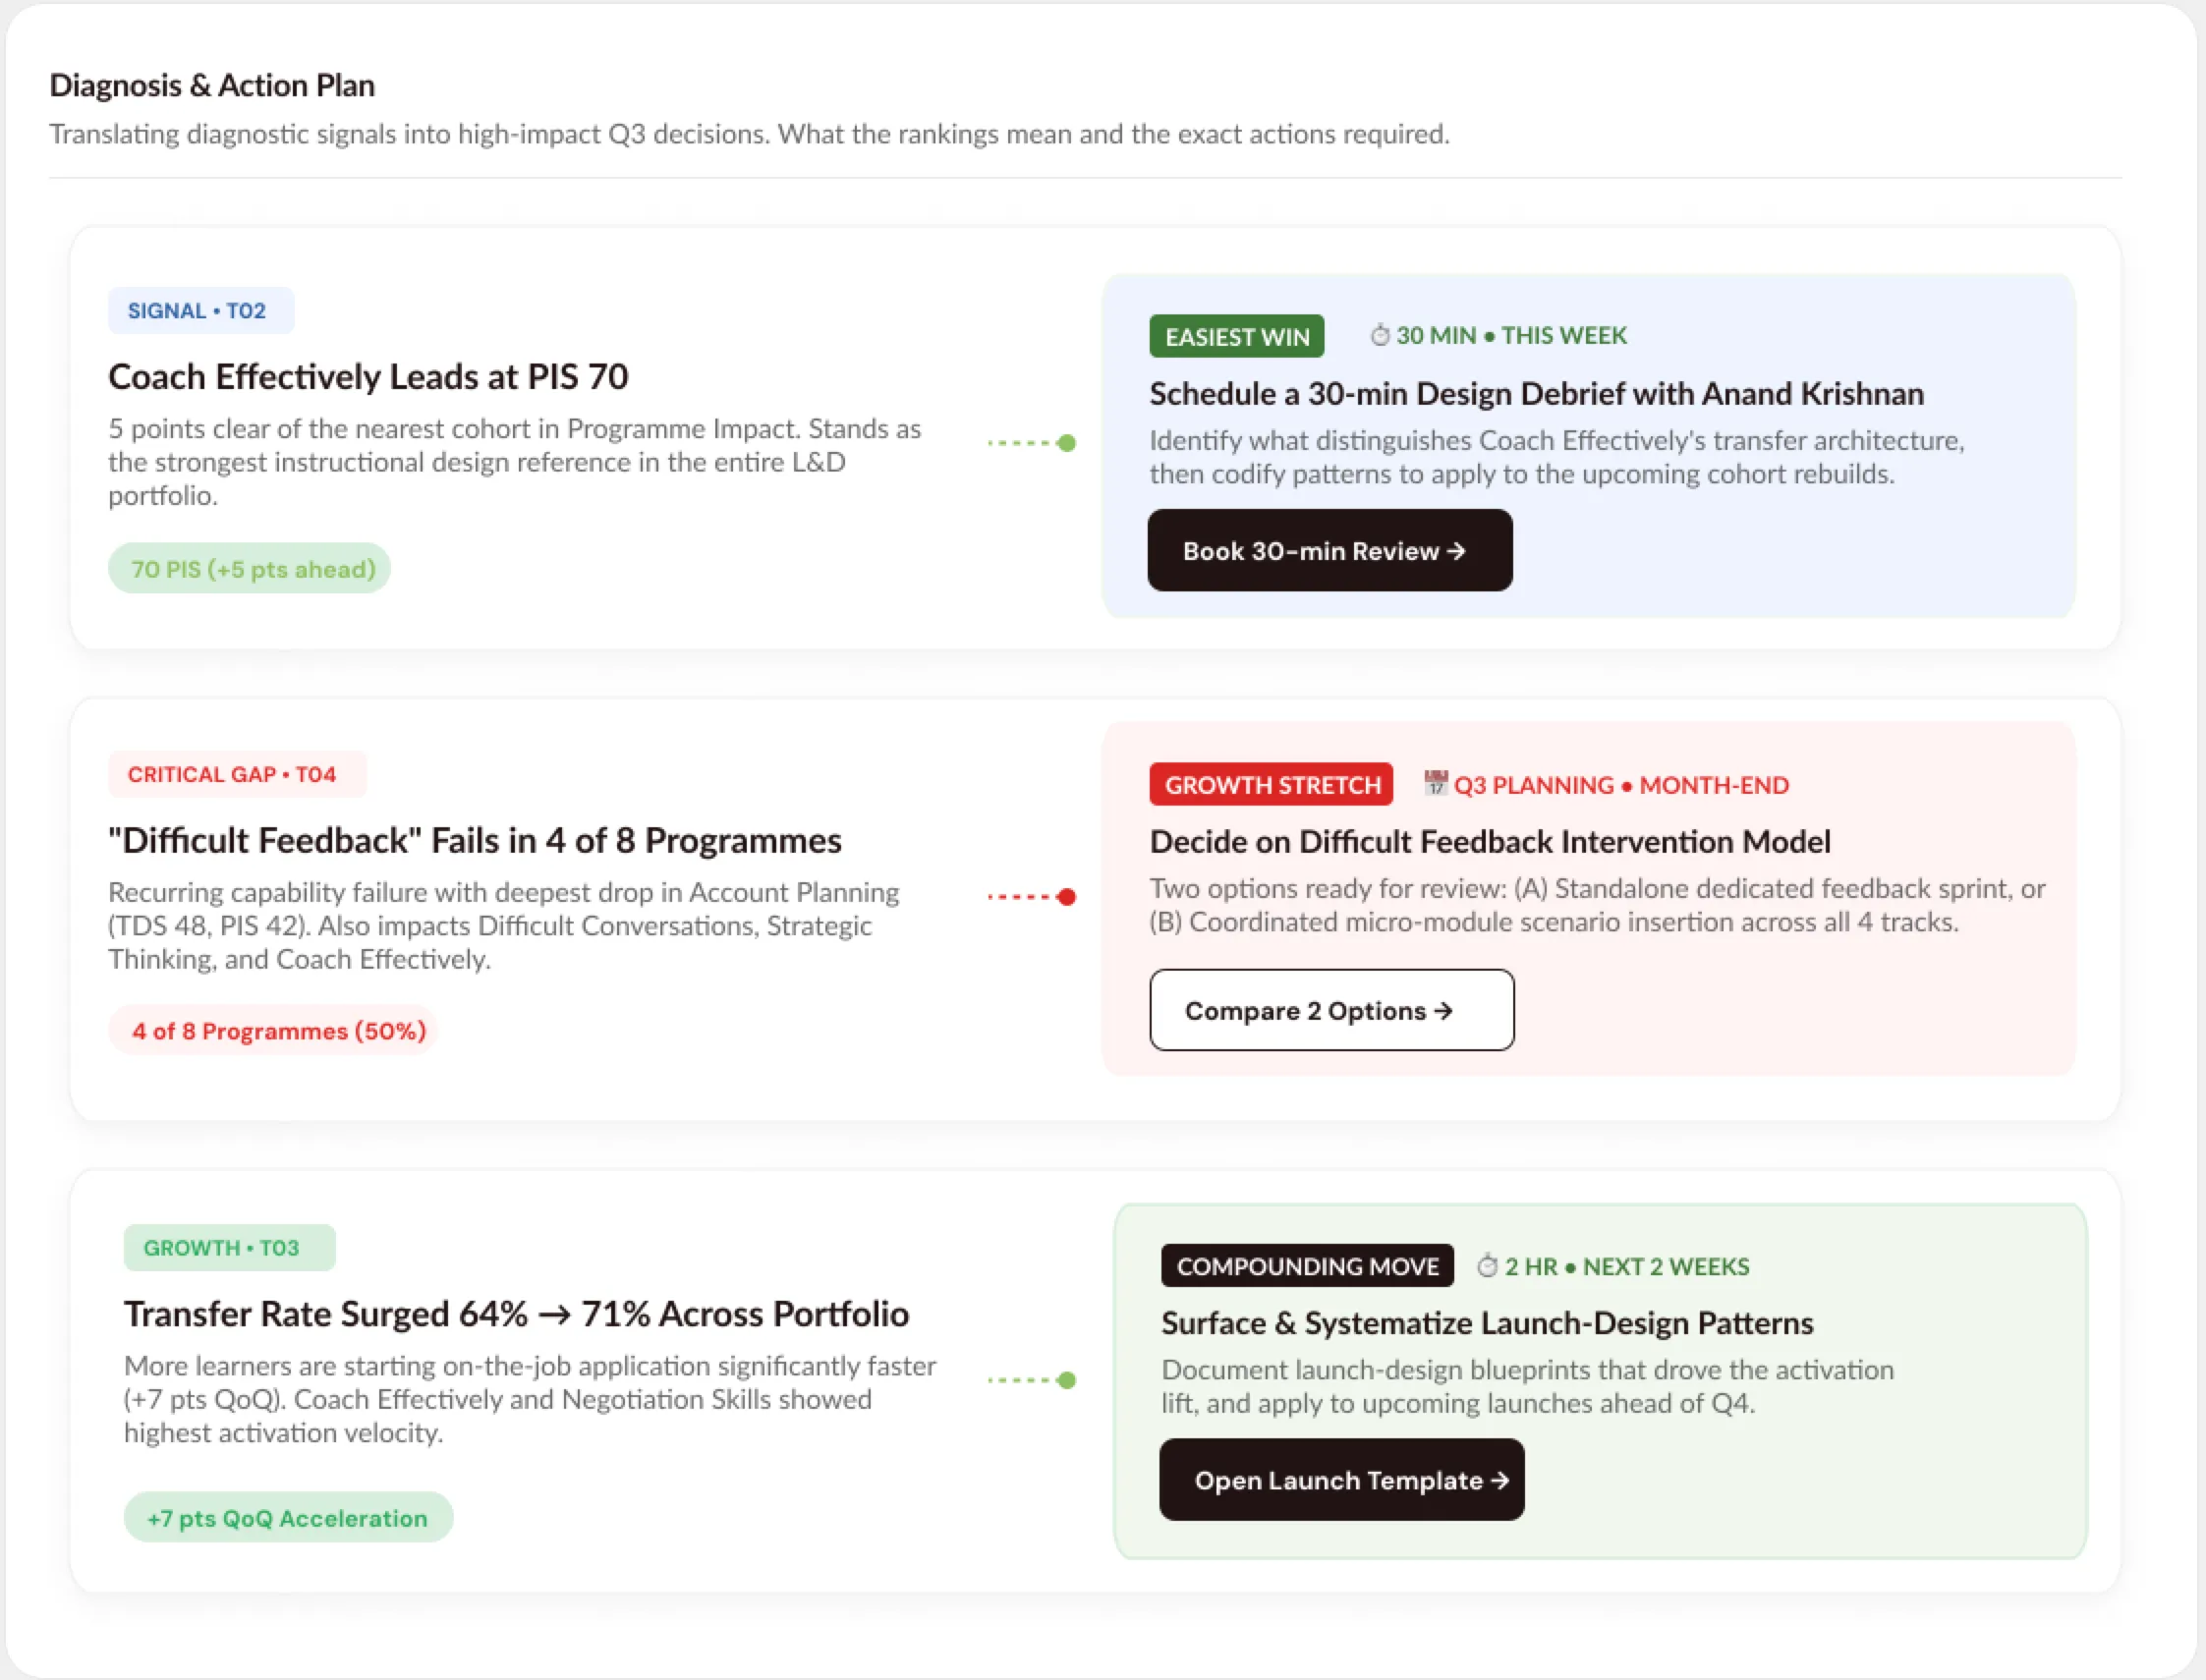
Every Velocity view finishes with three moves: one easy, one stretching, and one that builds over time. Learners and managers get the same three types, so a manager coaching a learner is using the same vocabulary. Each suggestion also says why it was chosen, which makes it read like advice rather than an instruction.
Easiest win
Quick, low effort, do it now
Learner
Reuse the story you rated highest.
Because your story ratings are already strong.
L&D manager · 30 min, this week
Schedule a 30-minute design debrief with the top trainer.
Because Coach Effectively leads impact at PIS 70.
Growth stretch
Harder, but where growth is
Learner
Try Feedback this week.
Because 4 of your 8 skills are still waiting for a first story.
L&D manager · Q3 planning, month end
Decide on a model for fixing Difficult Feedback.
Because it fails in 4 of 8 programmes.
Compounding move
Small now, bigger over time
Learner
Go back to Coaching.
Because Coaching showed your biggest before-and-after change.
L&D manager · 2 hrs, next 2 weeks
Turn the launch patterns that worked into a template.
Because transfer rate rose from 64% to 71%.
Decision 04: Zoom in only when you’re ready
Why: Showing everything at once overwhelms. Most visits need only the first screen.
The learner’s dashboard has three tabs, ordered from “right now” to “always”. The first answers most visits in a glance, and each deeper tab is one click away. The Back and Next cards at the bottom of every screen name the next view in plain words, so it’s always clear where you are. Tap a level to open it above.
Level 1 · This week
Overview
Where you are right now: your score, four signals and three next moves.
Open this screenLevel 2 · This programme
Detailed progress
How you’re applying the learning: topics, habits forming and impact areas.
Open this screenLevel 3 · Every programme
My journey
Your growth across every programme, and the skills you’ve carried forward.
Open this screen
Decision 05: Coach, don’t grade
Why: Velocity only works if people keep writing stories. Feeling judged is the fastest way to make them stop.
The copy talks like a supportive coach. It notices progress, keeps the next step small, and says “Not yet” instead of zero. Even being below average is framed as within reach. These lines are taken straight from the screens:
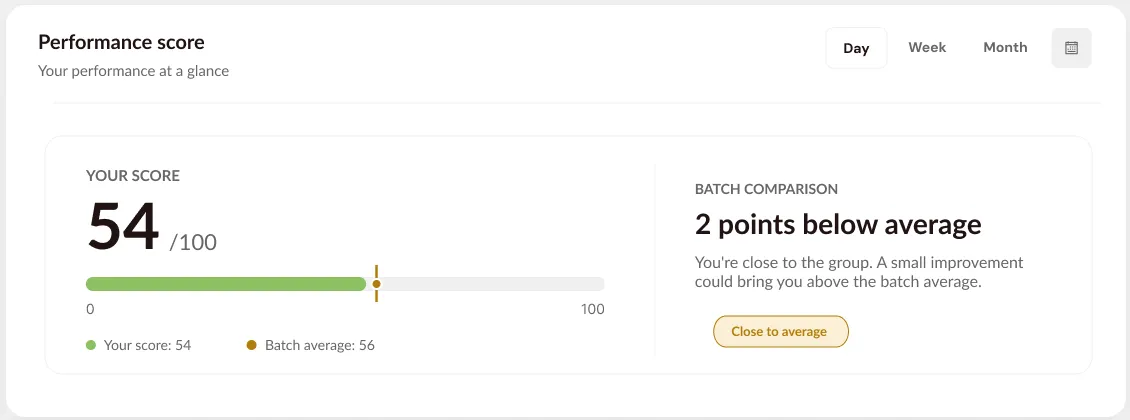
“A small situation from this week is enough.”
Story reminder
“Once is a trial. Twice is a habit forming.”
Skills becoming habits
“One real conversation this week is enough to start.”
Skills waiting for you
“Try it once more in a new situation. The second time is where a habit starts.”
Compounding move
“Not yet”
Impact areas, instead of 0%
“That is a pattern worth using again.”
Reach insight
Outcome
The designs give the team one repeatable pattern: a number, a sentence, a status word and a next step. It works the same way from a single learner’s progress to a whole training portfolio, which makes the remaining views (L2 to L7) faster to design and easier to learn.
What I learned
A dashboard isn’t finished when the charts are drawn. It’s finished when it answers “so what?”. Writing the sentence under each number was harder than designing the chart, and far more useful to the people reading it.