Ripples Learning · Web app
Ripples Discovery
Turning a document-style 360° report into a product trainers can actually read.
- My role
- UX lead (research & design)
- Timeline
- Oct 2025 – Present
- Platform
- Web app
- Team
- CEO, engineering
- Tools
- Figma, FigJam, Figma Dev Mode
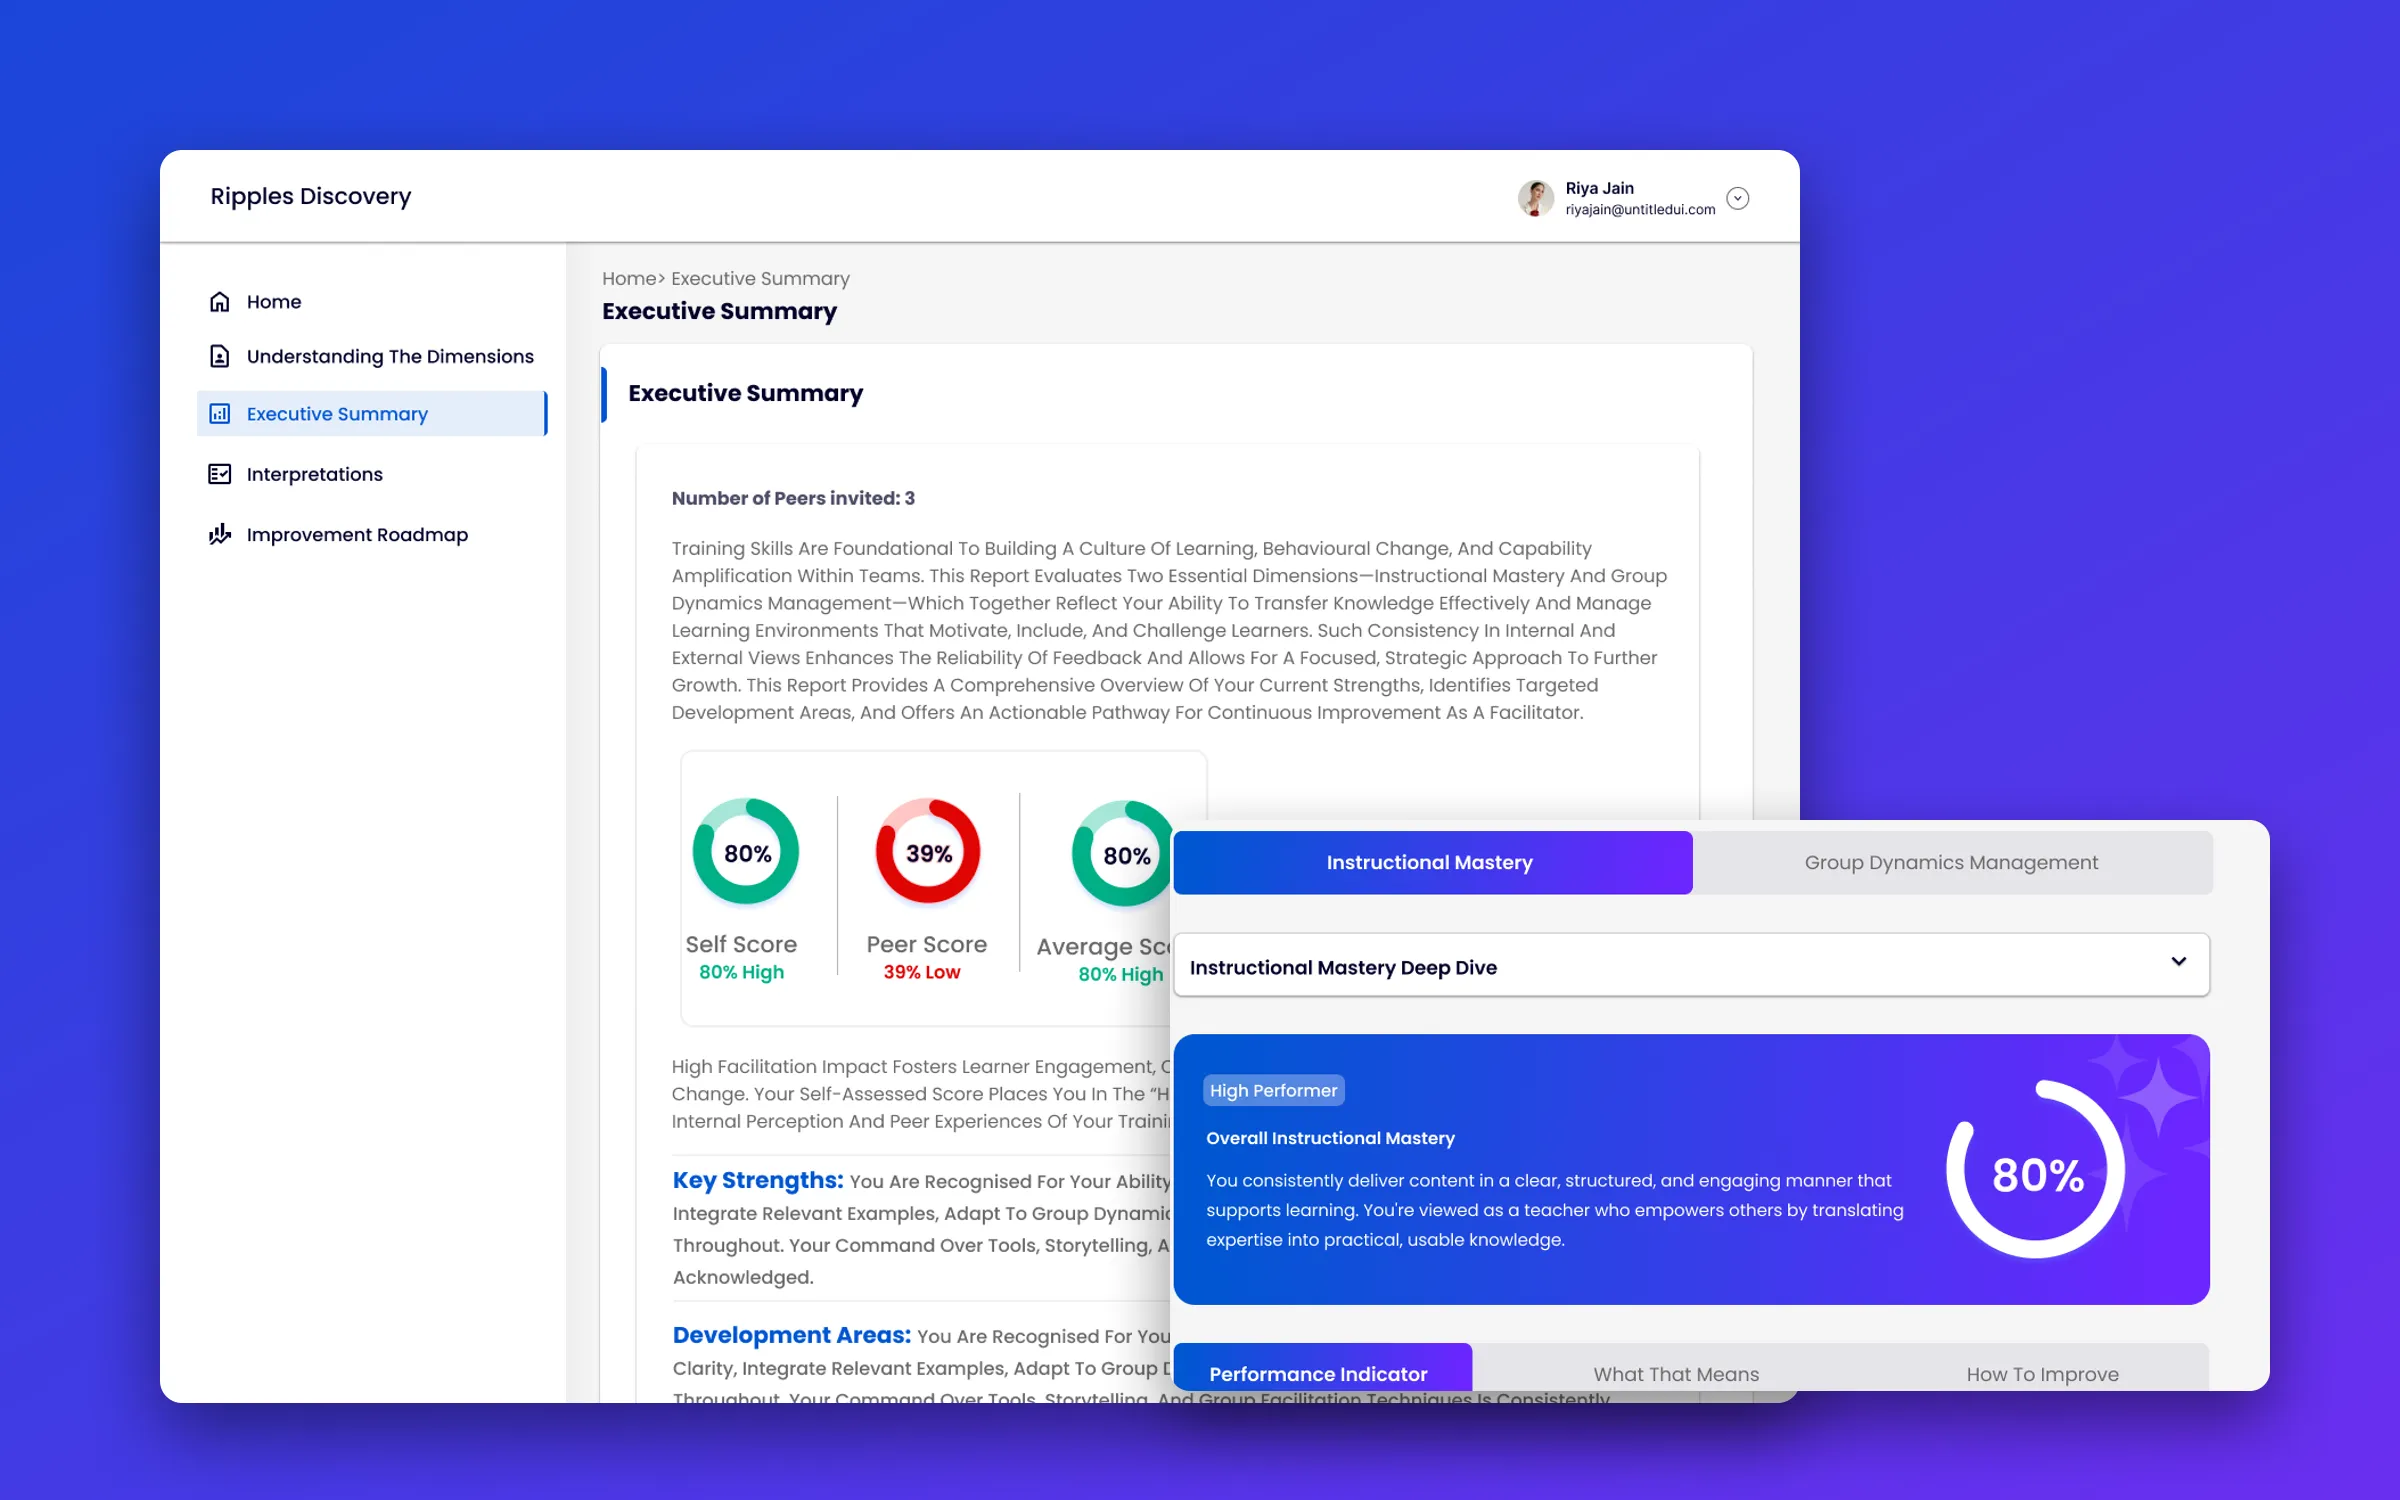
Ripples Discovery is a 360° assessment for trainers. They rate their own training skills, peers rate them too, and the platform turns both into a skills report. The report used to read like a long document. Working from the CEO's brief, and with developers involved from the first sketch, I redesigned it as a clear, layered product within the Ripples Discovery guidelines.
1
reusable score ring, used 14 times across two screens
4
levels of depth, from the summary down to reflection questions
Day 1
developers involved, which made handoff straightforward
- The problem
- The 360° skills report read like a long document. Scores were buried in paragraphs and nothing told trainers where to look first.
- The brief
- The CEO asked for a revamp: the same insight, presented as a product people can scan, explore and act on.
- The constraint
- Design within what the developers could build. They were involved from the start, so every pattern was agreed before it was polished.
- Shown here
- Two high-fidelity screens, Executive Summary and Interpretations, built on the Ripples Discovery guidelines.
The challenge
In Ripples Discovery, a trainer rates their own skills, and the peers who watched them train rate them too. Comparing the two views is where the insight lives. Does the trainer see themselves the way their audience does?
The old report delivered that insight as a document. It read top to bottom, gave every paragraph the same weight, and left trainers to dig the numbers out of the text. The CEO wanted it revamped into something that felt like a product, and it had to be buildable by the existing development team without new, custom engineering.
How might we make a trainer’s strengths and gaps obvious at a glance, while keeping every detail one click away and the build simple for developers?
From document to product
Before · a document
Illustration
- Read top to bottom, like a PDF
- Scores buried inside paragraphs
- Every section given the same weight
- No sense of what to do next
After · a product
- Scores first, as rings with a status word
- A sidebar to jump straight to any section
- Detail tucked into tabs and accordions
- Every section ends in takeaways and next steps
Explore the screens
Pick a screen, then scroll inside the frame to see all of it.
Trainer report
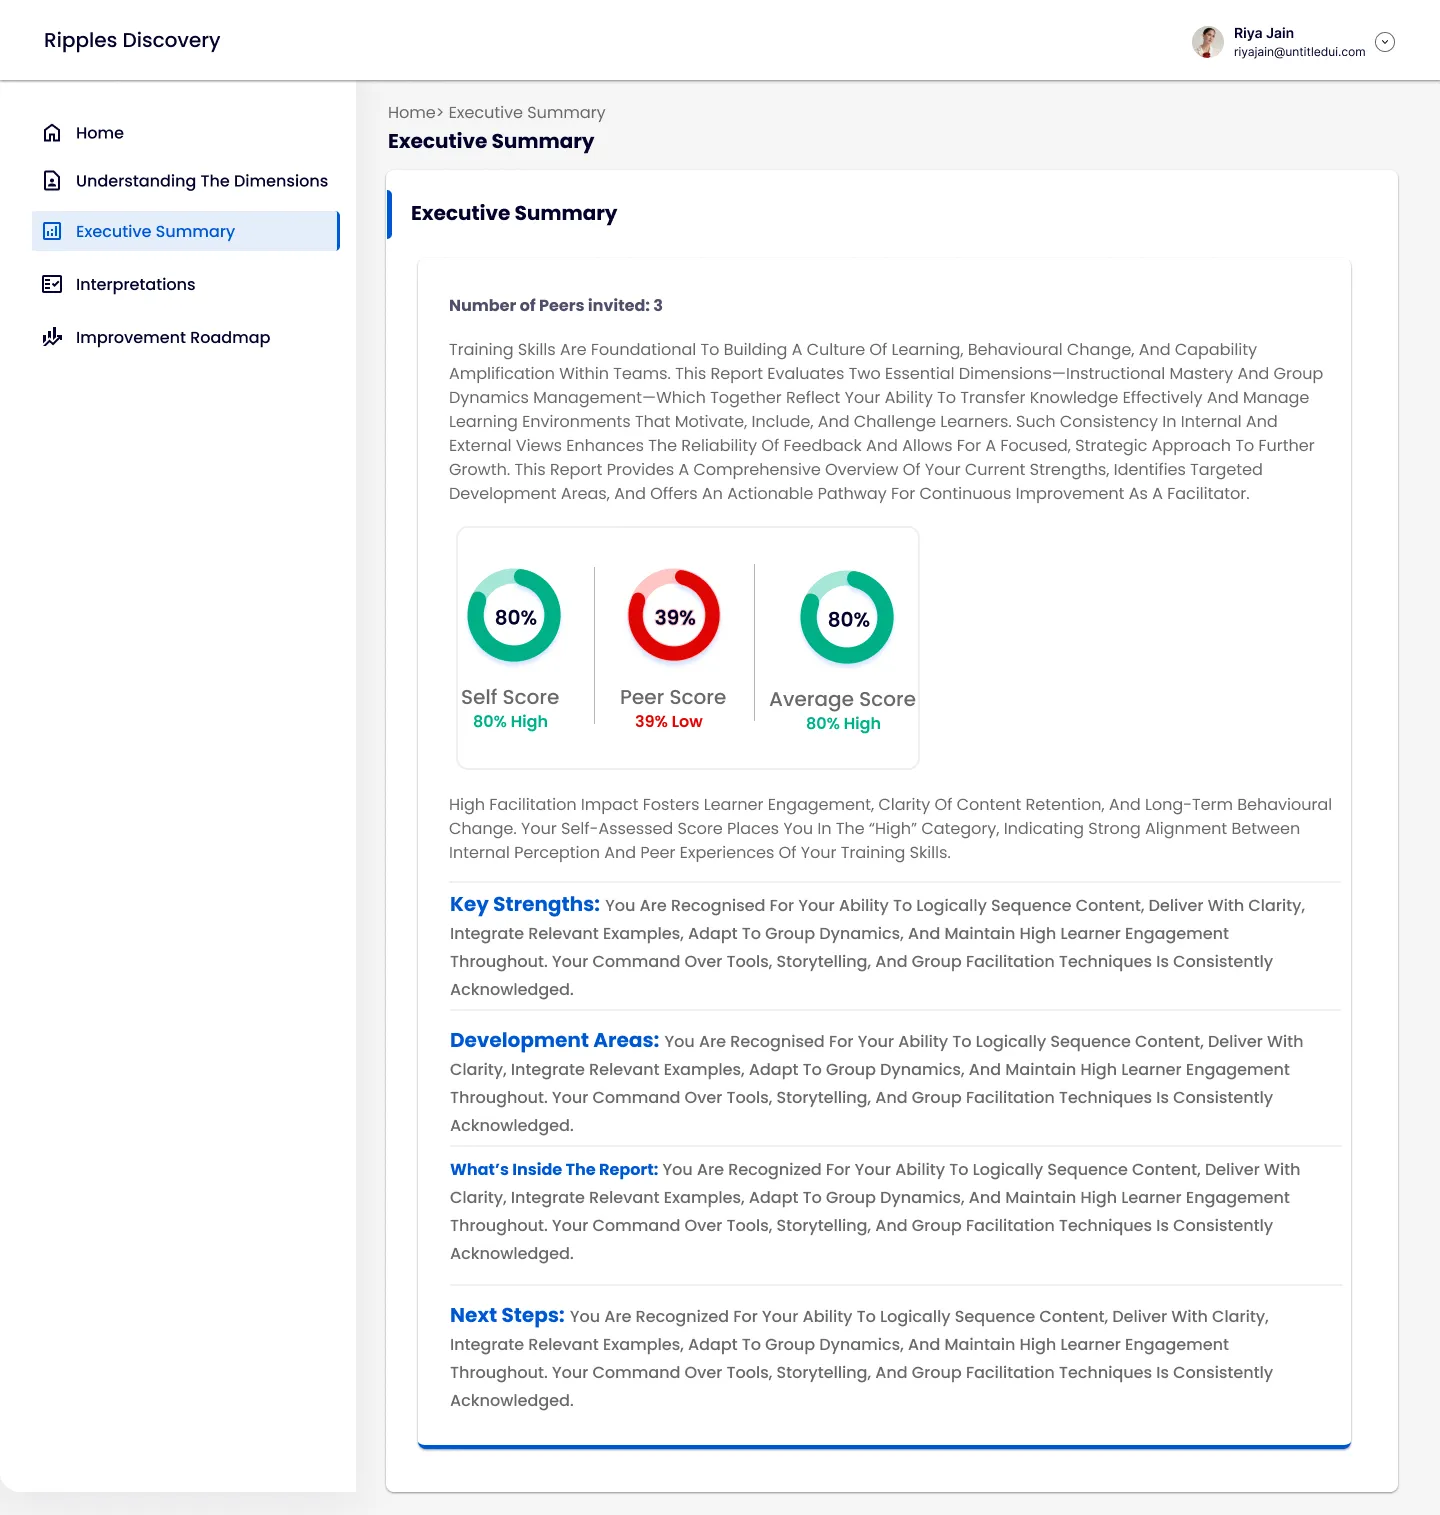
Executive Summary
“How did I do, in a nutshell?”
What to look for
- How many peers rated you, stated first
- Self, peer and average scores side by side as rings
- Strengths, development areas and next steps as labelled, scannable blocks
Names, scores and copy are sample data.

Trainer report
Interpretations
“Where exactly am I strong, and where do others see me differently?”
What to look for
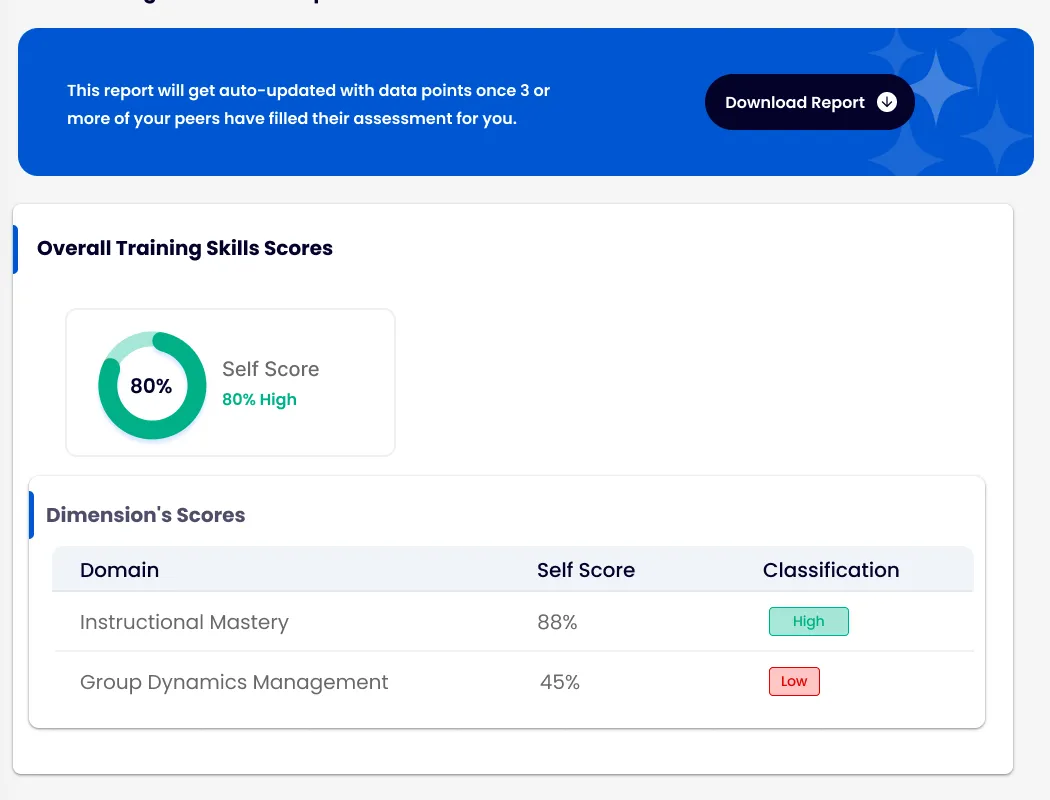
- Overall score and each dimension, tagged High or Low
- Tabs for each dimension, with a deep dive for each one
- Every indicator card compares your score with your peers’ score
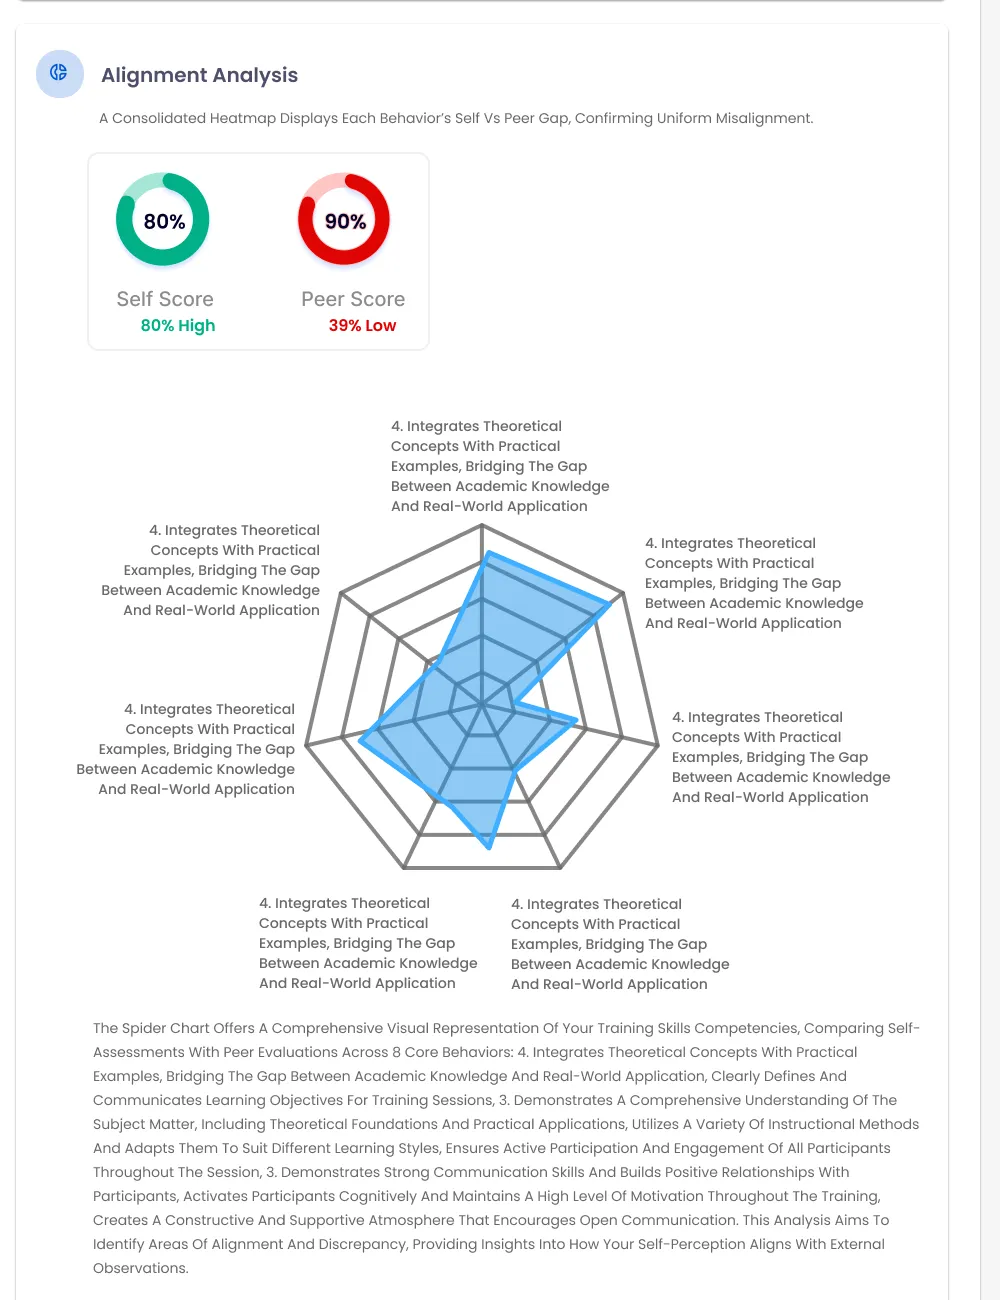
- A radar chart for alignment, then checklists of analysis and recommendations
Names, scores and copy are sample data.
Four design decisions
Decision 01: Scores first, words second
Why: A trainer opening their report wants one answer before anything else: how did I do?
The Executive Summary leads with the numbers, then explains them. Hover or tap the pins.
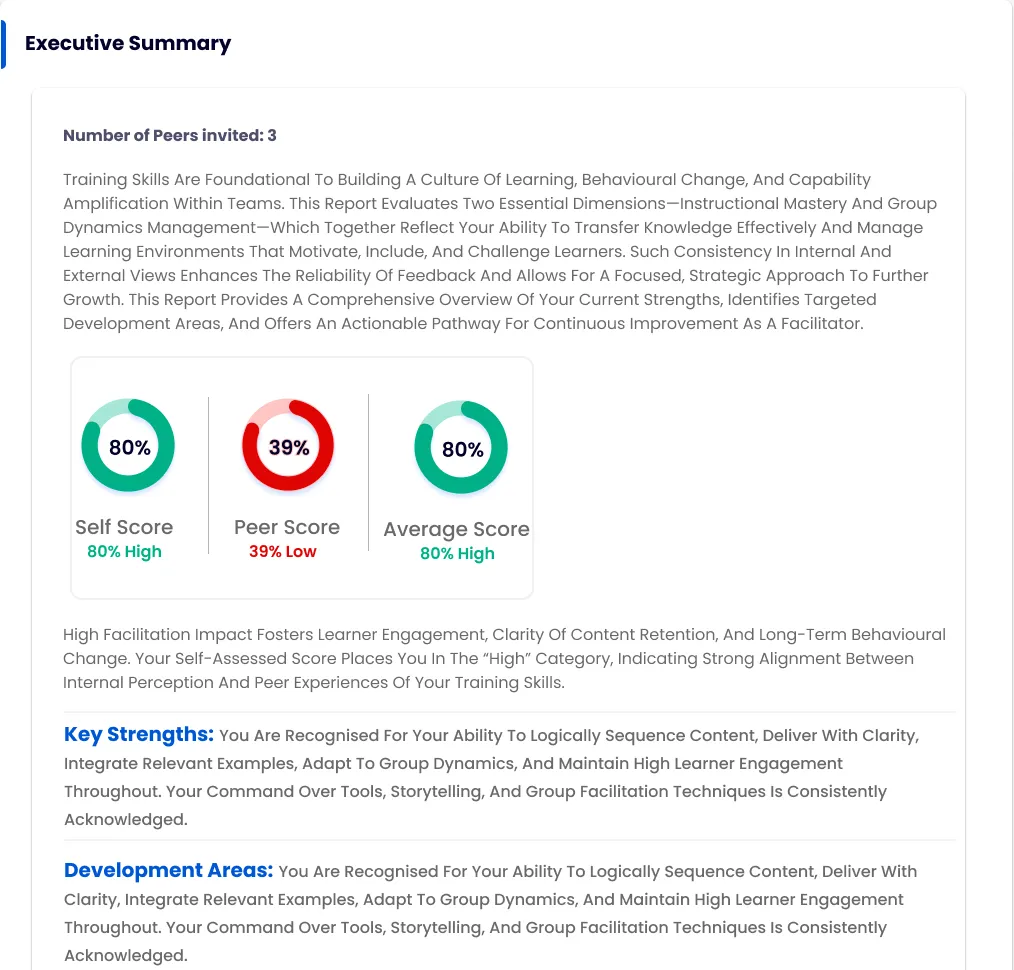
- 1
Context before the score
The number of peers who were invited comes first, so trainers know how much feedback the scores rest on.
- 2
Three views in one row
Self, peer and average scores share one ring component, so they can be compared at a glance.
- 3
Colour and a word
Every score carries a status word, High or Low, as well as its colour, so it never relies on colour alone.
- 4
Labelled, scannable blocks
Key strengths, development areas and next steps each open with a bold label, so trainers can skim to the part they need.
Decision 02: Self and peers, side by side, everywhere
Why: The value of a 360° is the gap between how you see yourself and how others see you, so that gap should always be visible.
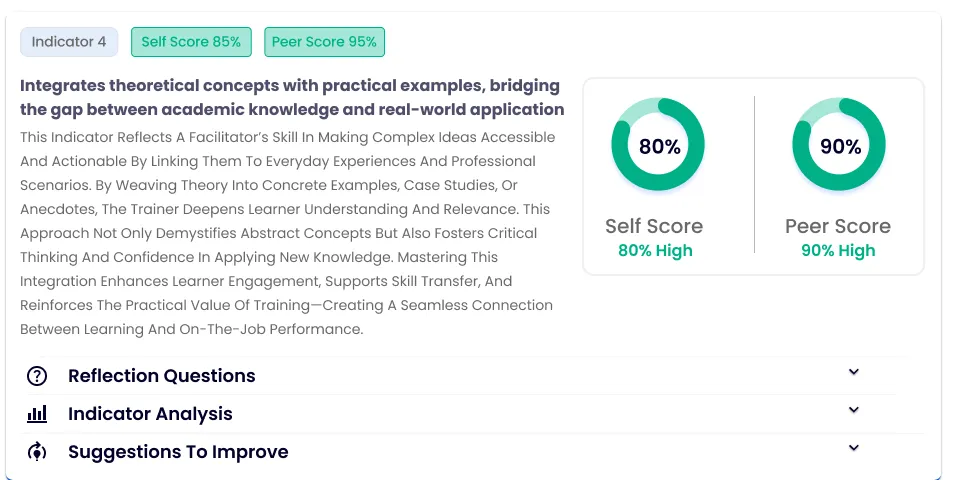
Every indicator follows the same card template: the behaviour being measured, a short explanation, and the self and peer scores next to each other.
- 1
The headline in tags
Indicator number, self score and peer score are tagged above the title, so the card can be understood before it is read.
- 2
Two rings, one comparison
Self and peer scores sit side by side in matching rings, so any gap jumps out.
- 3
Detail when you want it
Reflection questions, indicator analysis and suggestions stay collapsed until the trainer opens them.
Decision 03: Depth on demand
Why: A document shows everything at once. A product can let people go as deep as they want, one layer at a time.
The report is organised as four nested levels. Each answers a narrower question, and nothing below the first level is shown until the trainer asks for it.
Executive summary · sidebar page
“How did I do overall?”
Dimension · tabs
“How am I doing in Instructional Mastery, or in Group Dynamics?”
Indicator · card
“Which behaviours are strong, and do my peers agree?”
Reflection · accordion
“What should I think about, and how do I improve?”
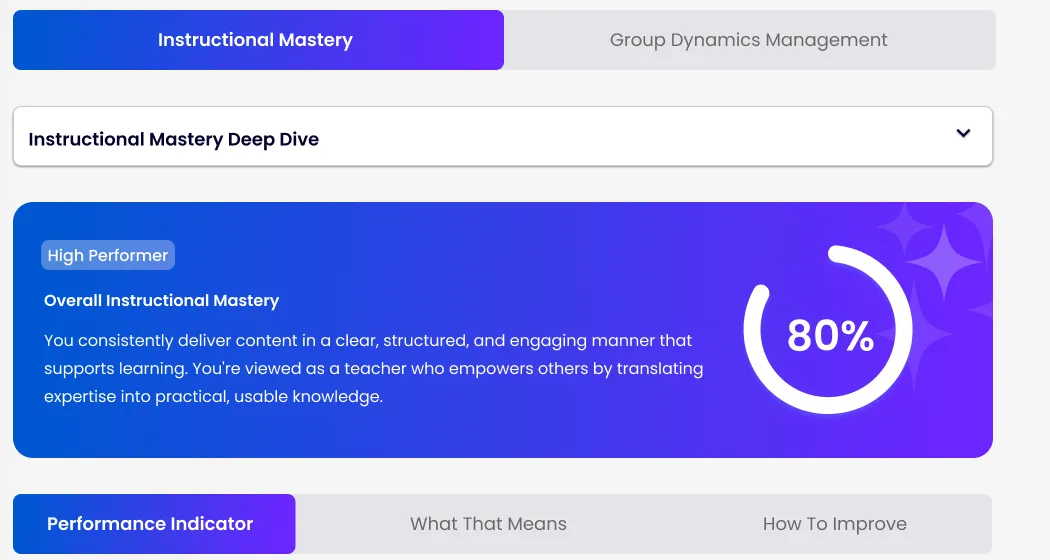
Decision 04: End with patterns and plain-language takeaways
Why: Scores say where you stand. Trainers also need to know what it means and what to do next.
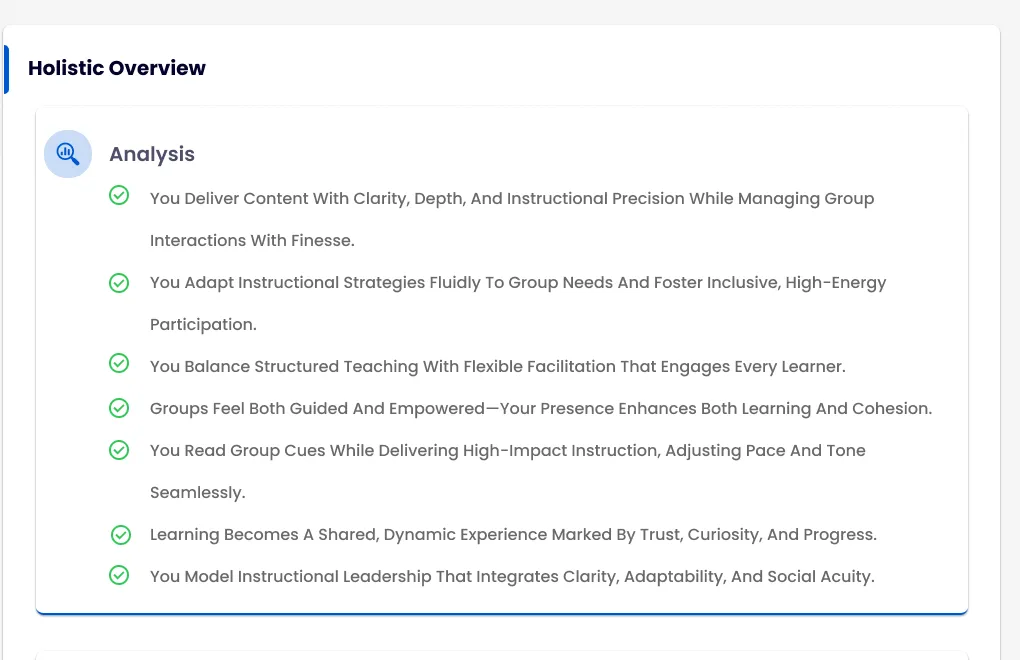
The Interpretations page closes with a holistic overview. A radar chart shows where self and peer views line up or split across behaviours, then short checklists turn the analysis into insights and recommendations.
Designed with developers, not handed to them
The revamp had to fit what the development team could build. So I brought developers in at the start rather than at handoff, and checked every pattern for feasibility before polishing it.
CEO
The brief: turn the report into a product, plus direction and sign-off
Developers
What could be built, raised from the first sketch rather than at handoff
- CEO brief
- Feasibility check
- Design
- Dev review
- Handoff
Developers reviewed each screen before it was finalised
A small kit builds the whole report
Instead of designing every section from scratch, I built the report from a handful of components, each designed once and reused. That kept the design consistent and the build predictable, and it made handoff a matter of pointing developers to components they already knew.
Score ring
× 14
Every score in the report, in green or red with a status word.
Status tag
High · Low
Classifies each dimension in the scores table.
Tab bar
× 2
Switches dimensions, then views within a dimension.
Accordion row
× 12
Reflection, analysis and suggestions on every indicator.
Section card
every section
A blue rule marks the start of each section.
Checklist
× 4
Analysis, solutions, insights and recommendations.
Built on the Ripples Discovery guidelines
Everything follows the Ripples Discovery guidelines: one blue for structure and actions, a blue-to-violet gradient reserved for highlights, and green and red kept strictly for score status. The colours below are sampled from the designs.
Discovery blue
#0056d2
Active tabs, section rules and actions
Highlight gradient
#0056d2 → #393dea → #6927fe
High-performer and summary cards
High
#00b087
Strong scores
Low
#df0404
Scores that need attention
Outcome
The new report gives trainers a clear path from the headline score down to specific behaviours and next steps. Because it was built from a small kit of components the developers had already agreed to, handoff was straightforward.
What I learned
Bringing developers in from day one changed the work. Constraints that would have meant rework at handoff became design inputs early on, and a small, reusable kit turned out to be both easier to build and easier for trainers to learn.