C1 India · Mobile & desktop
Procfox
Redesigning an e-auction portal so buyers and suppliers always know what needs them next.
- My role
- UI/UX designer (end-to-end)
- Timeline
- Jun 2023 – Dec 2024
- Platform
- Mobile & desktop
- Team
- Project manager, customer, developers
- Tools
- Figma, FigJam
Procfox is a B2B procurement platform. Its auction module lets buyers create and run English, Dutch and Yankee auctions, and lets suppliers bid live. I redesigned the experience end to end, from gathering requirements with the project manager and customer through wireframes and feedback rounds to high-fidelity screens, backed by a design system and style guide.
30%
improvement in workflow efficiency
10
auction statuses, each one tap away with a live count
1
design system and style guide behind every screen
- The problem
- The legacy auction portal had grown feature by feature: dense screens, inconsistent patterns, and no quick way to see which auctions needed attention.
- The product
- Procfox e-auctions. Buyers create and run English, Dutch and Yankee auctions, and approved suppliers bid live against each other.
- My job
- End-to-end UX: requirements, problem finding, wireframes, feedback rounds, high-fidelity screens, and the design system and style guide.
- Shown here
- Four desktop screens across two roles, the auctioneer and the supplier, plus the style guide behind them.
The challenge
An e-auction is time-critical. Once it goes live, suppliers have hours or minutes to bid, and the auctioneer has to watch many auctions at once while others wait for approval or set-up. The legacy portal treated everything the same: long forms, flat tables, and no signal of what was urgent.
How might we let auctioneers and suppliers see, at a glance, which auctions need them now, and reach any detail in one or two clicks?
How I worked
Every flow went through the same loop. I gathered requirements, identified the real problems behind them in formal and informal meetings with the project manager and the customer, sketched low-fidelity wireframes, and refined them with their feedback until the flow was agreed. Only then did it move to high fidelity.
Project manager
Requirements, scope and priorities
Customer
How auctions really run, their rules and their pain points
- Requirements
- Find the problems
- Meetings
- Wireframes
- Feedback
- Refine
Wireframe, feedback and refine, repeated until each flow was agreed
From wireframe to final screen
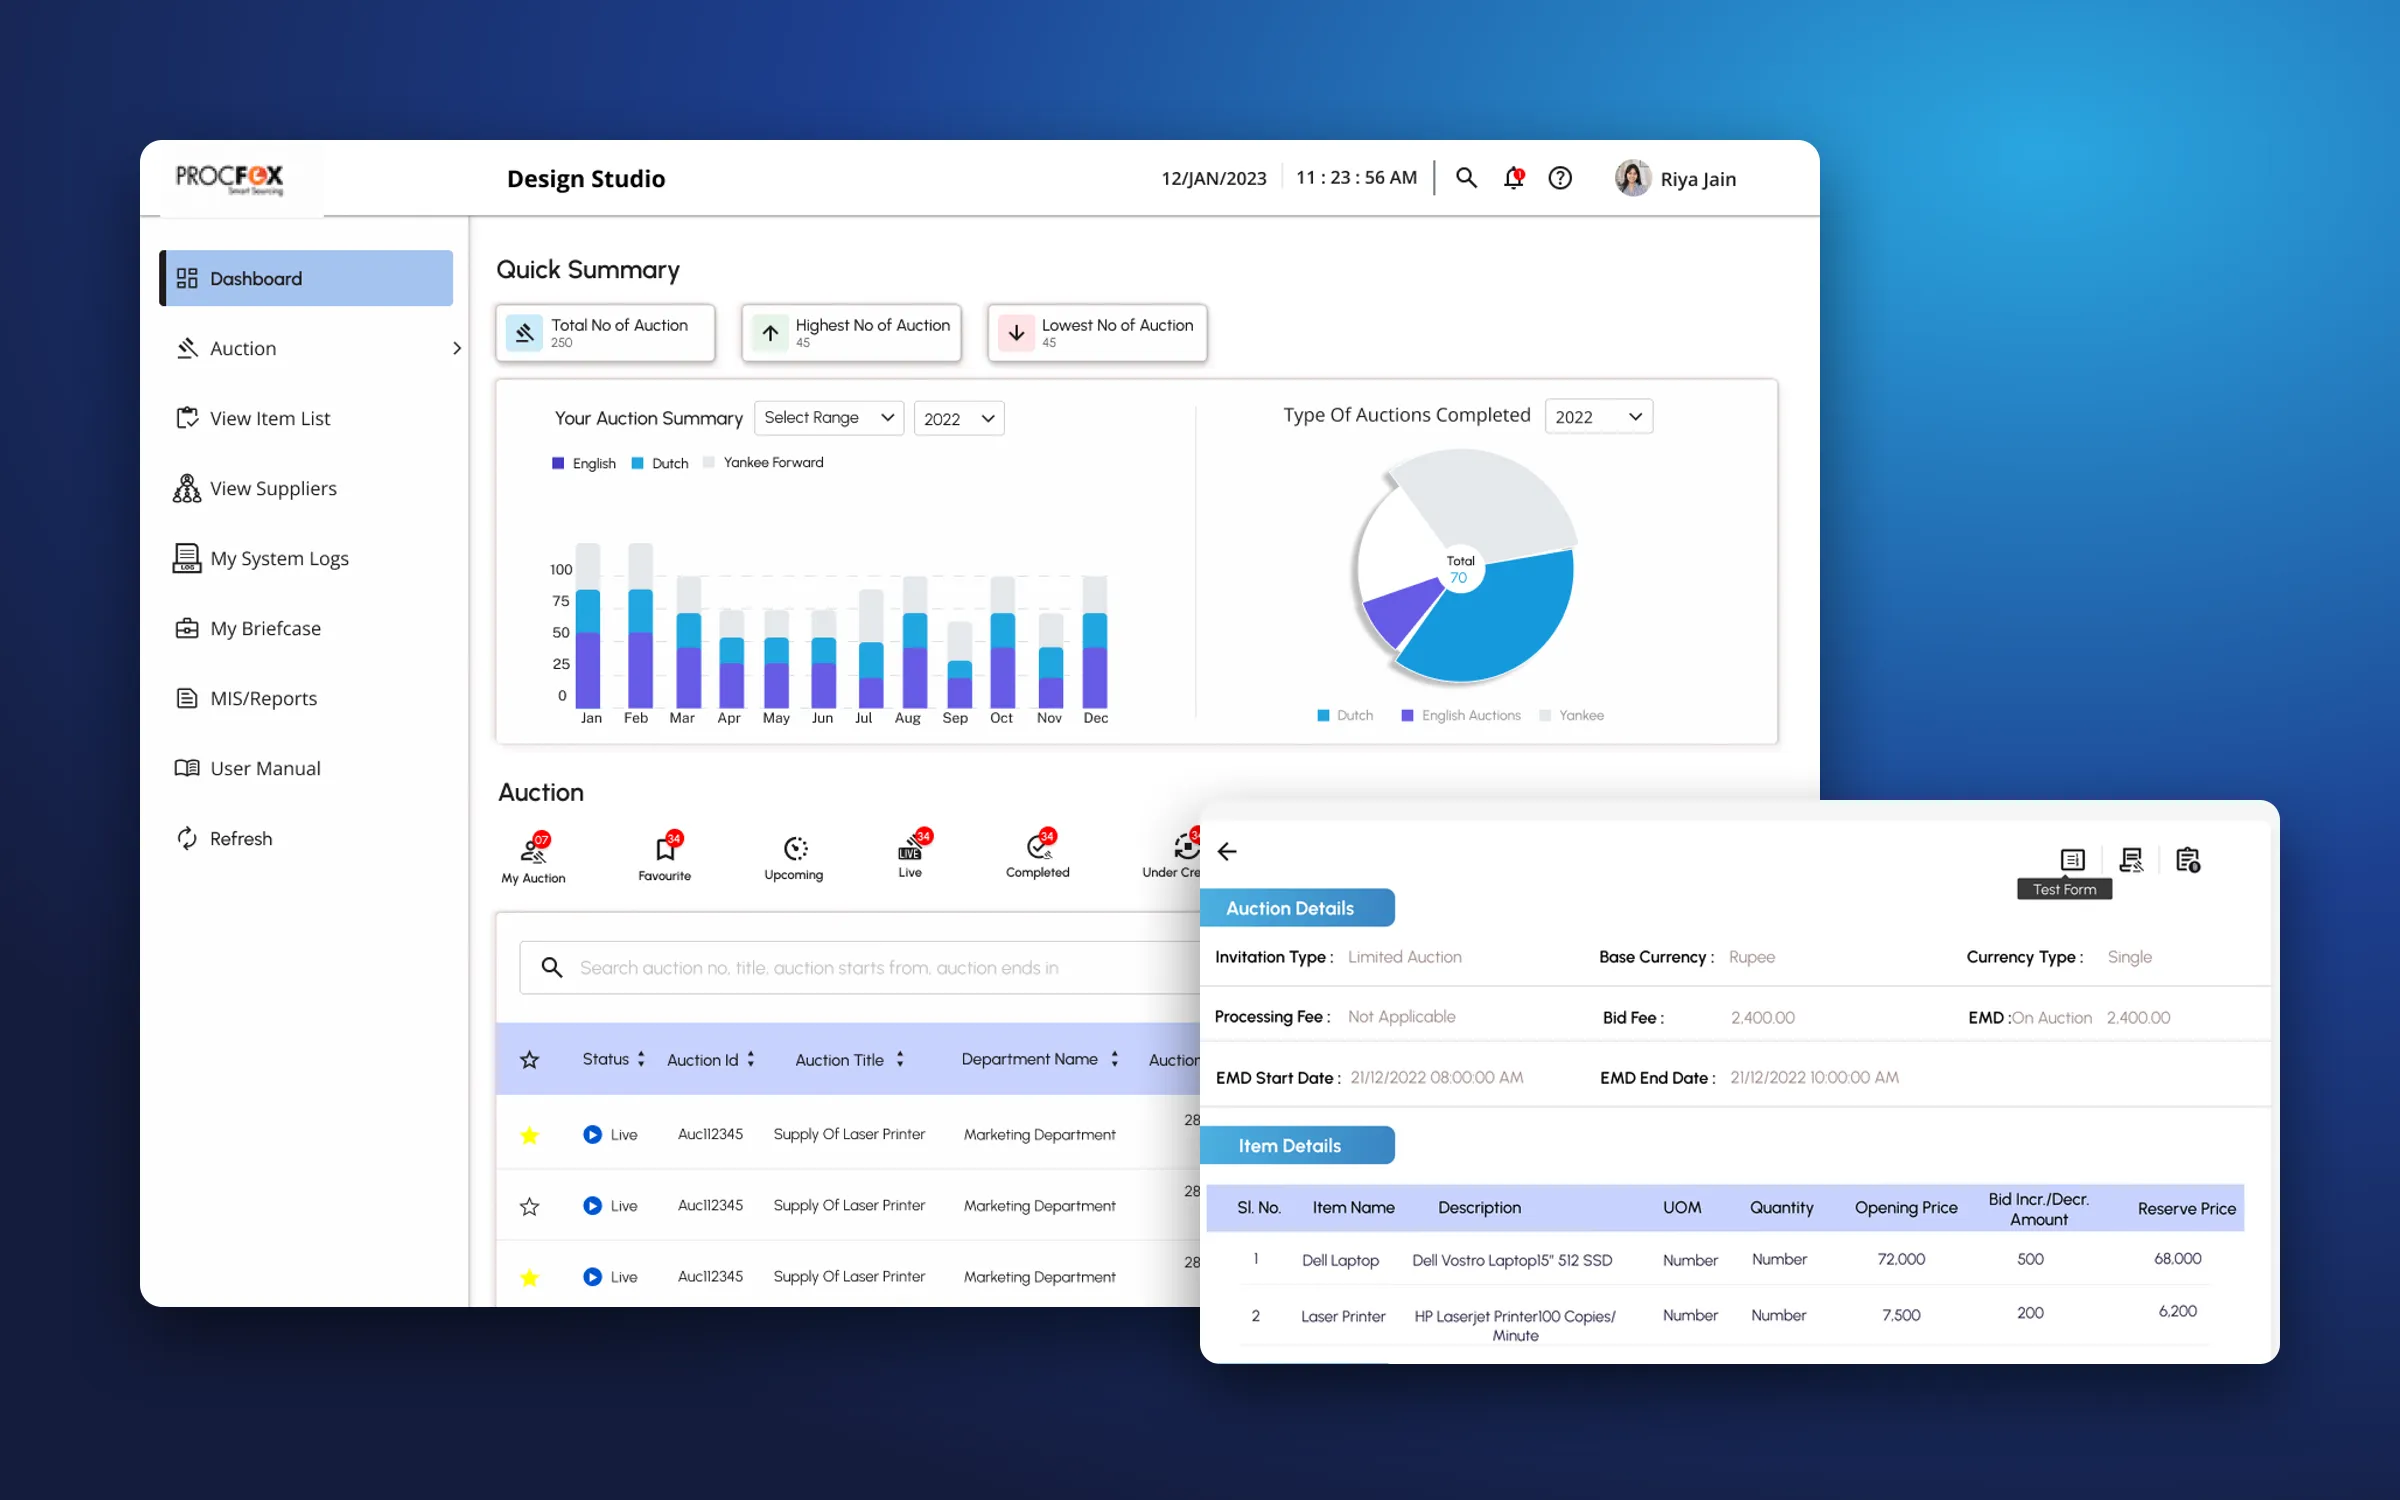
Structure first, polish second. Drag the handle to see how the dashboard’s layout stayed the same from wireframe to final design, while hierarchy, colour and real data were layered on top.
Explore the screens
Pick a screen, then scroll inside the frame to see all of it.
Auctioneer
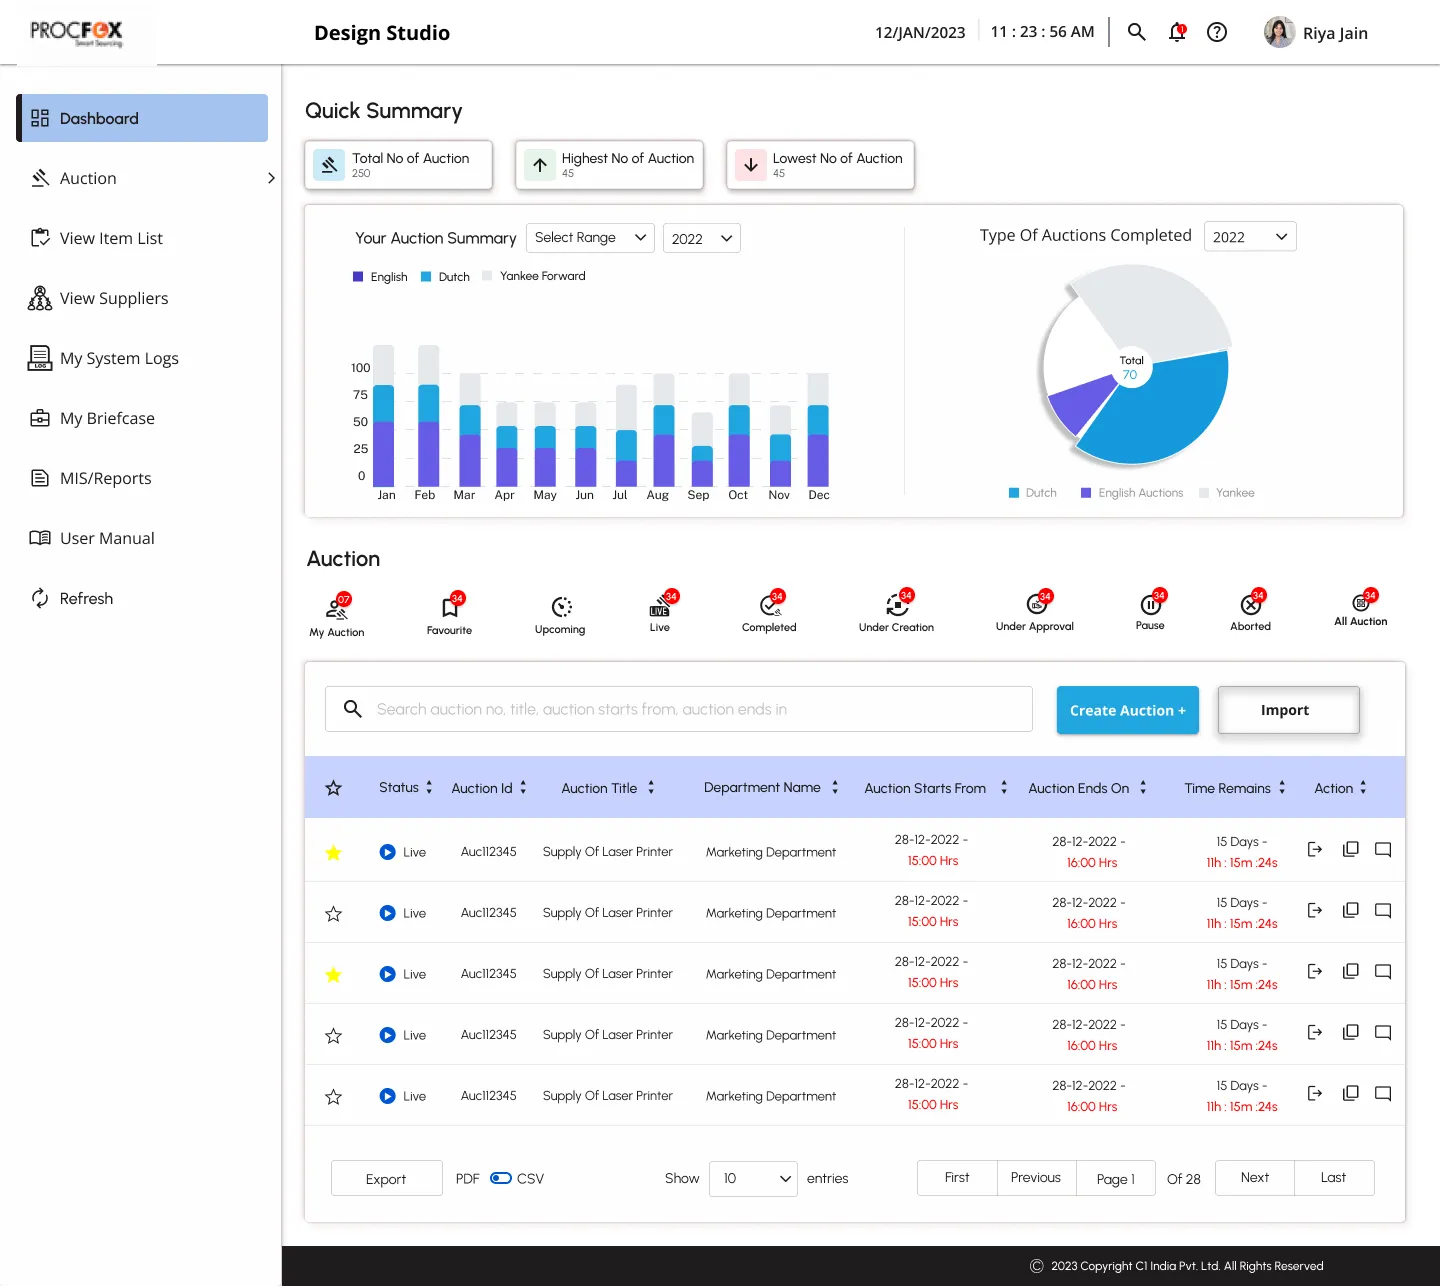
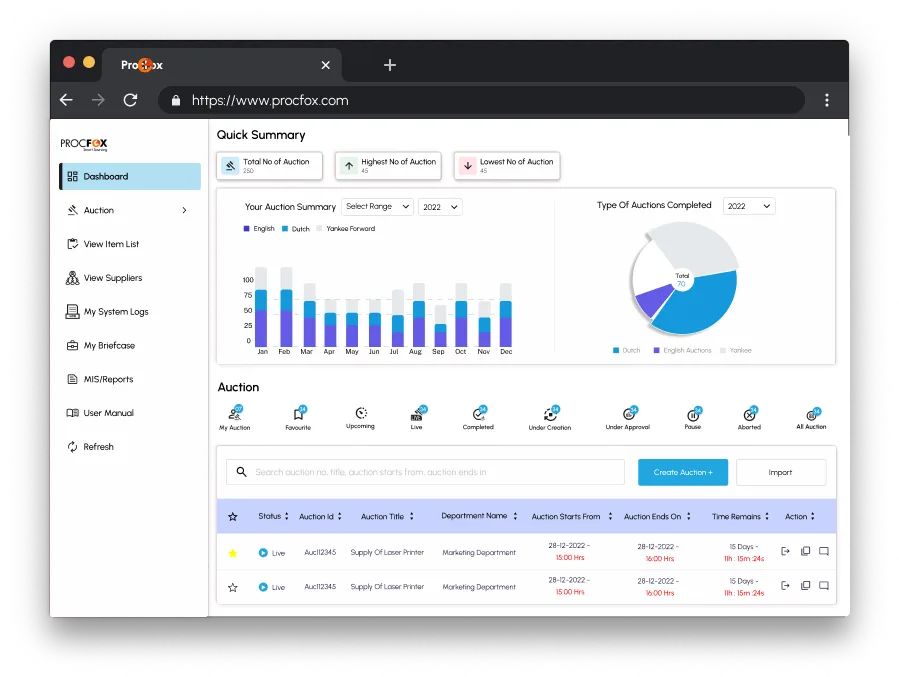
Dashboard
“What needs my attention today?”
What to look for
- Three headline counts, then two charts by auction type
- Ten status filters, each with a live count
- The auction list with time remaining in red
Names, auctions and figures are sample data.
Auctioneer
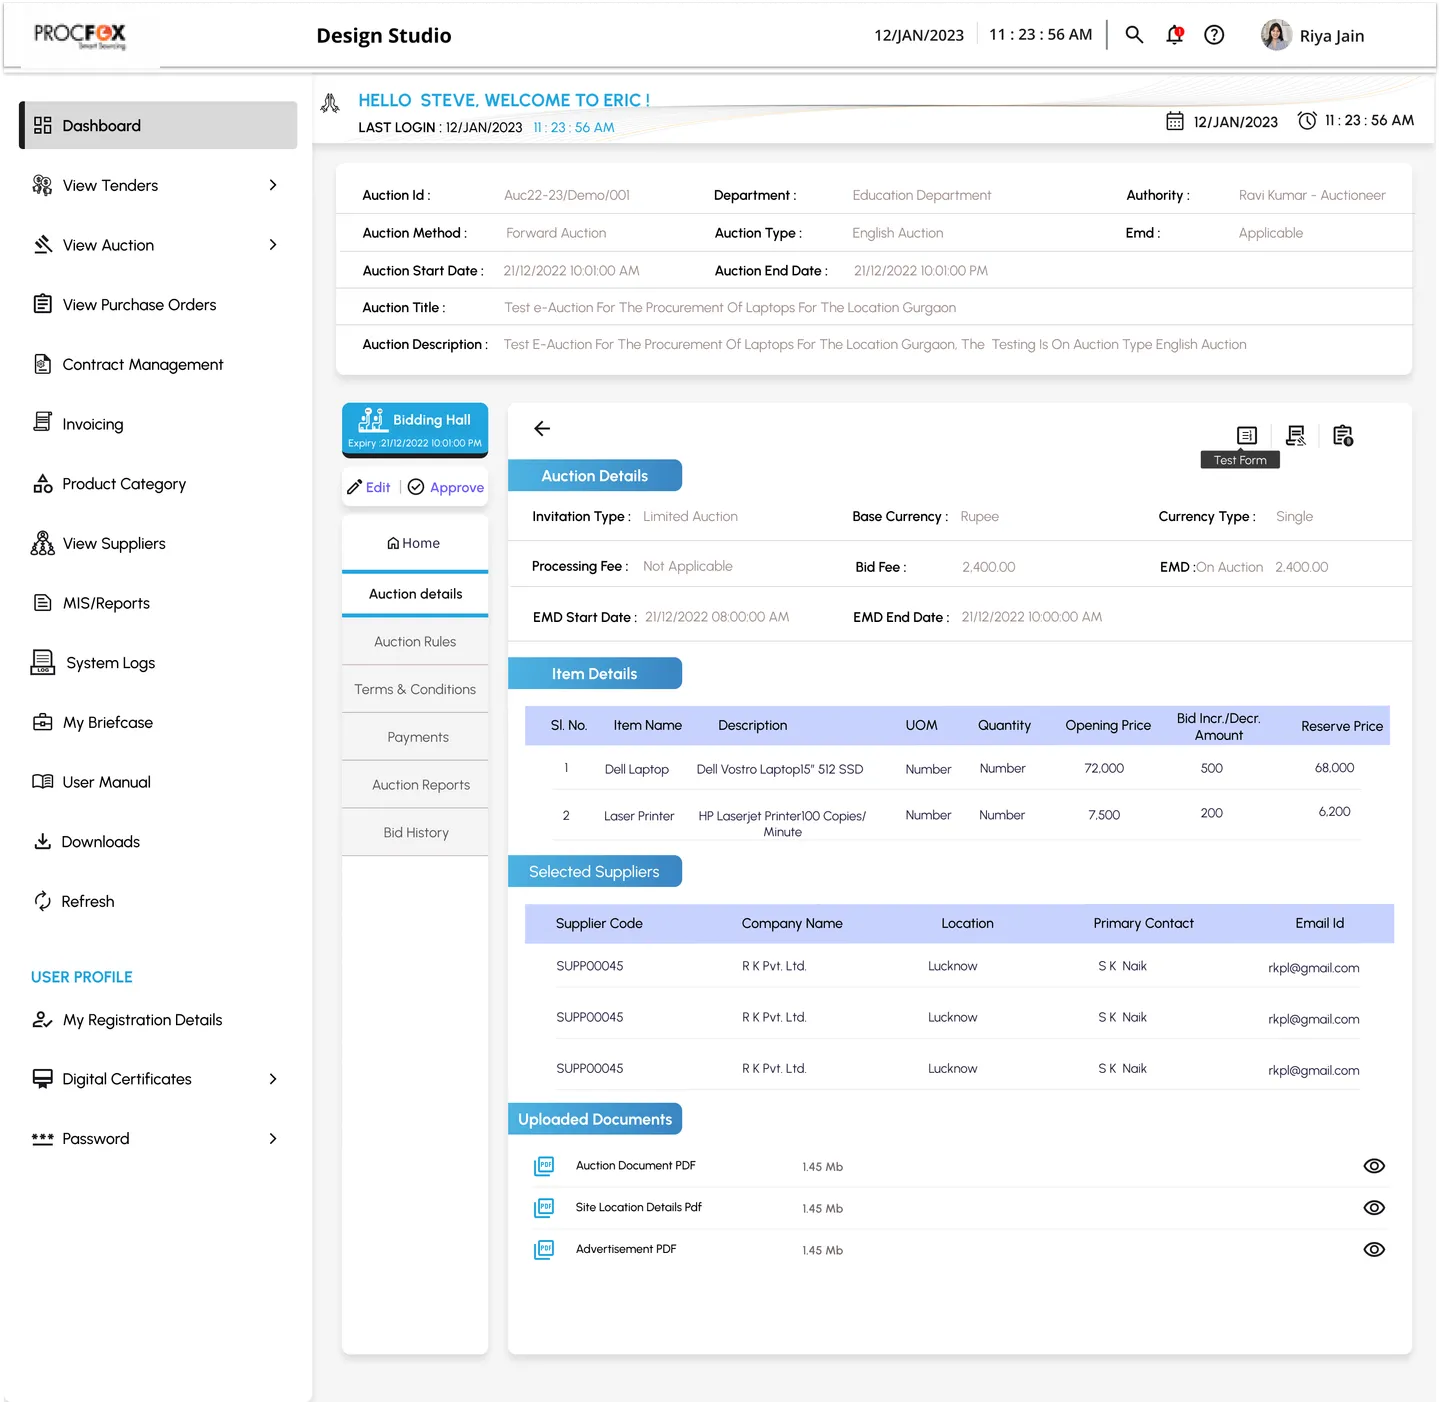
Auction details
“Is this auction set up correctly, and can I approve it?”
What to look for
- Key facts about the auction pinned at the top
- The Bidding Hall, Edit and Approve beside the content
- Labelled sections for details, items, suppliers and documents
Names, auctions and figures are sample data.
Auctioneer
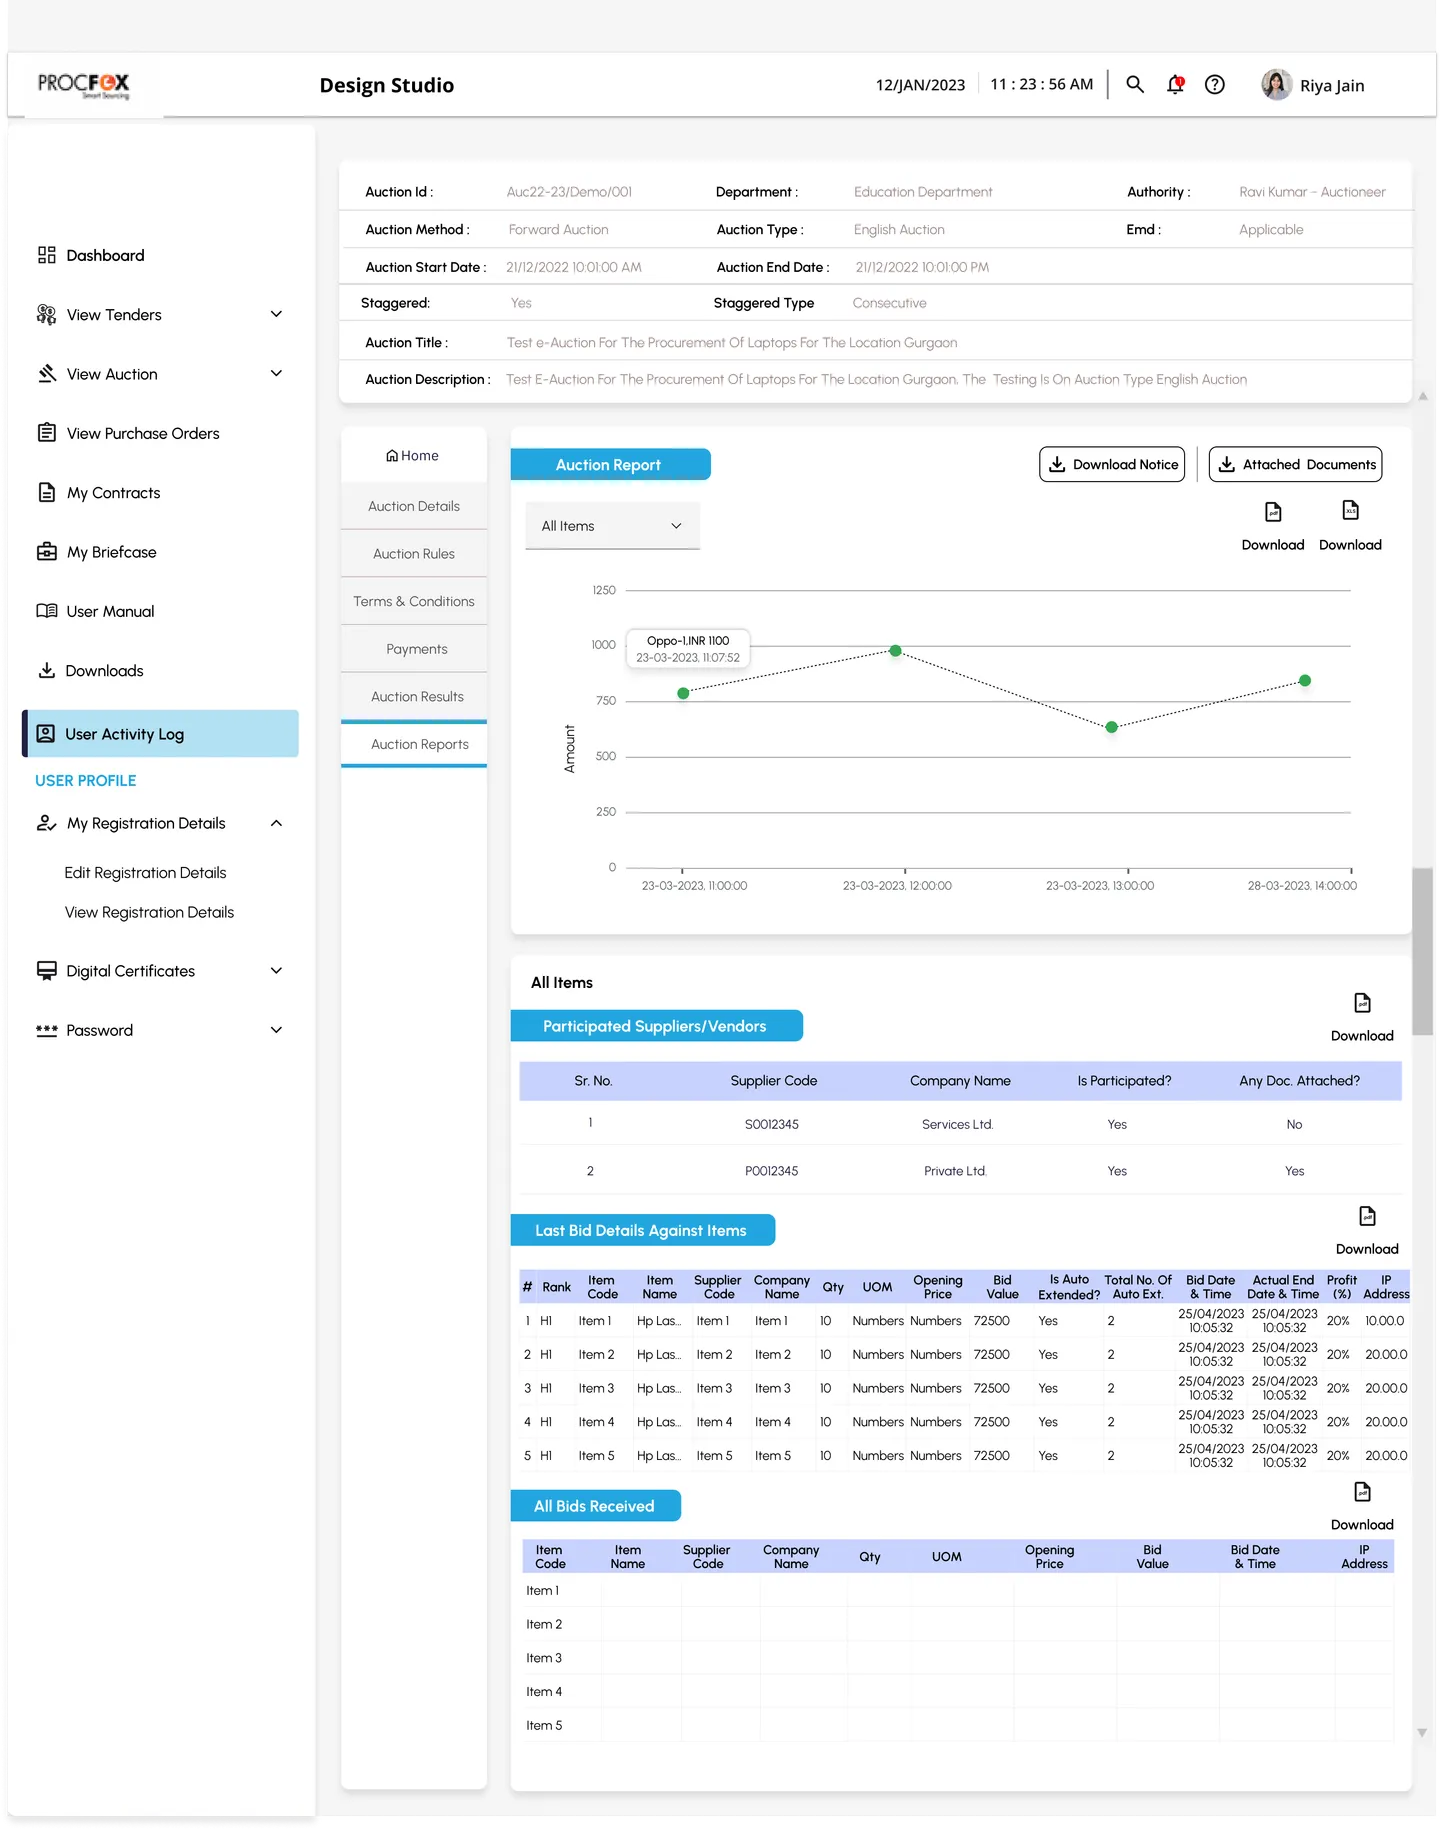
Auction report
“Who took part, and who won each item?”
What to look for
- A bid chart over time, filterable by item
- Every participating supplier, their last bids and all bids received
- PDF and spreadsheet downloads for each table
Names, auctions and figures are sample data.
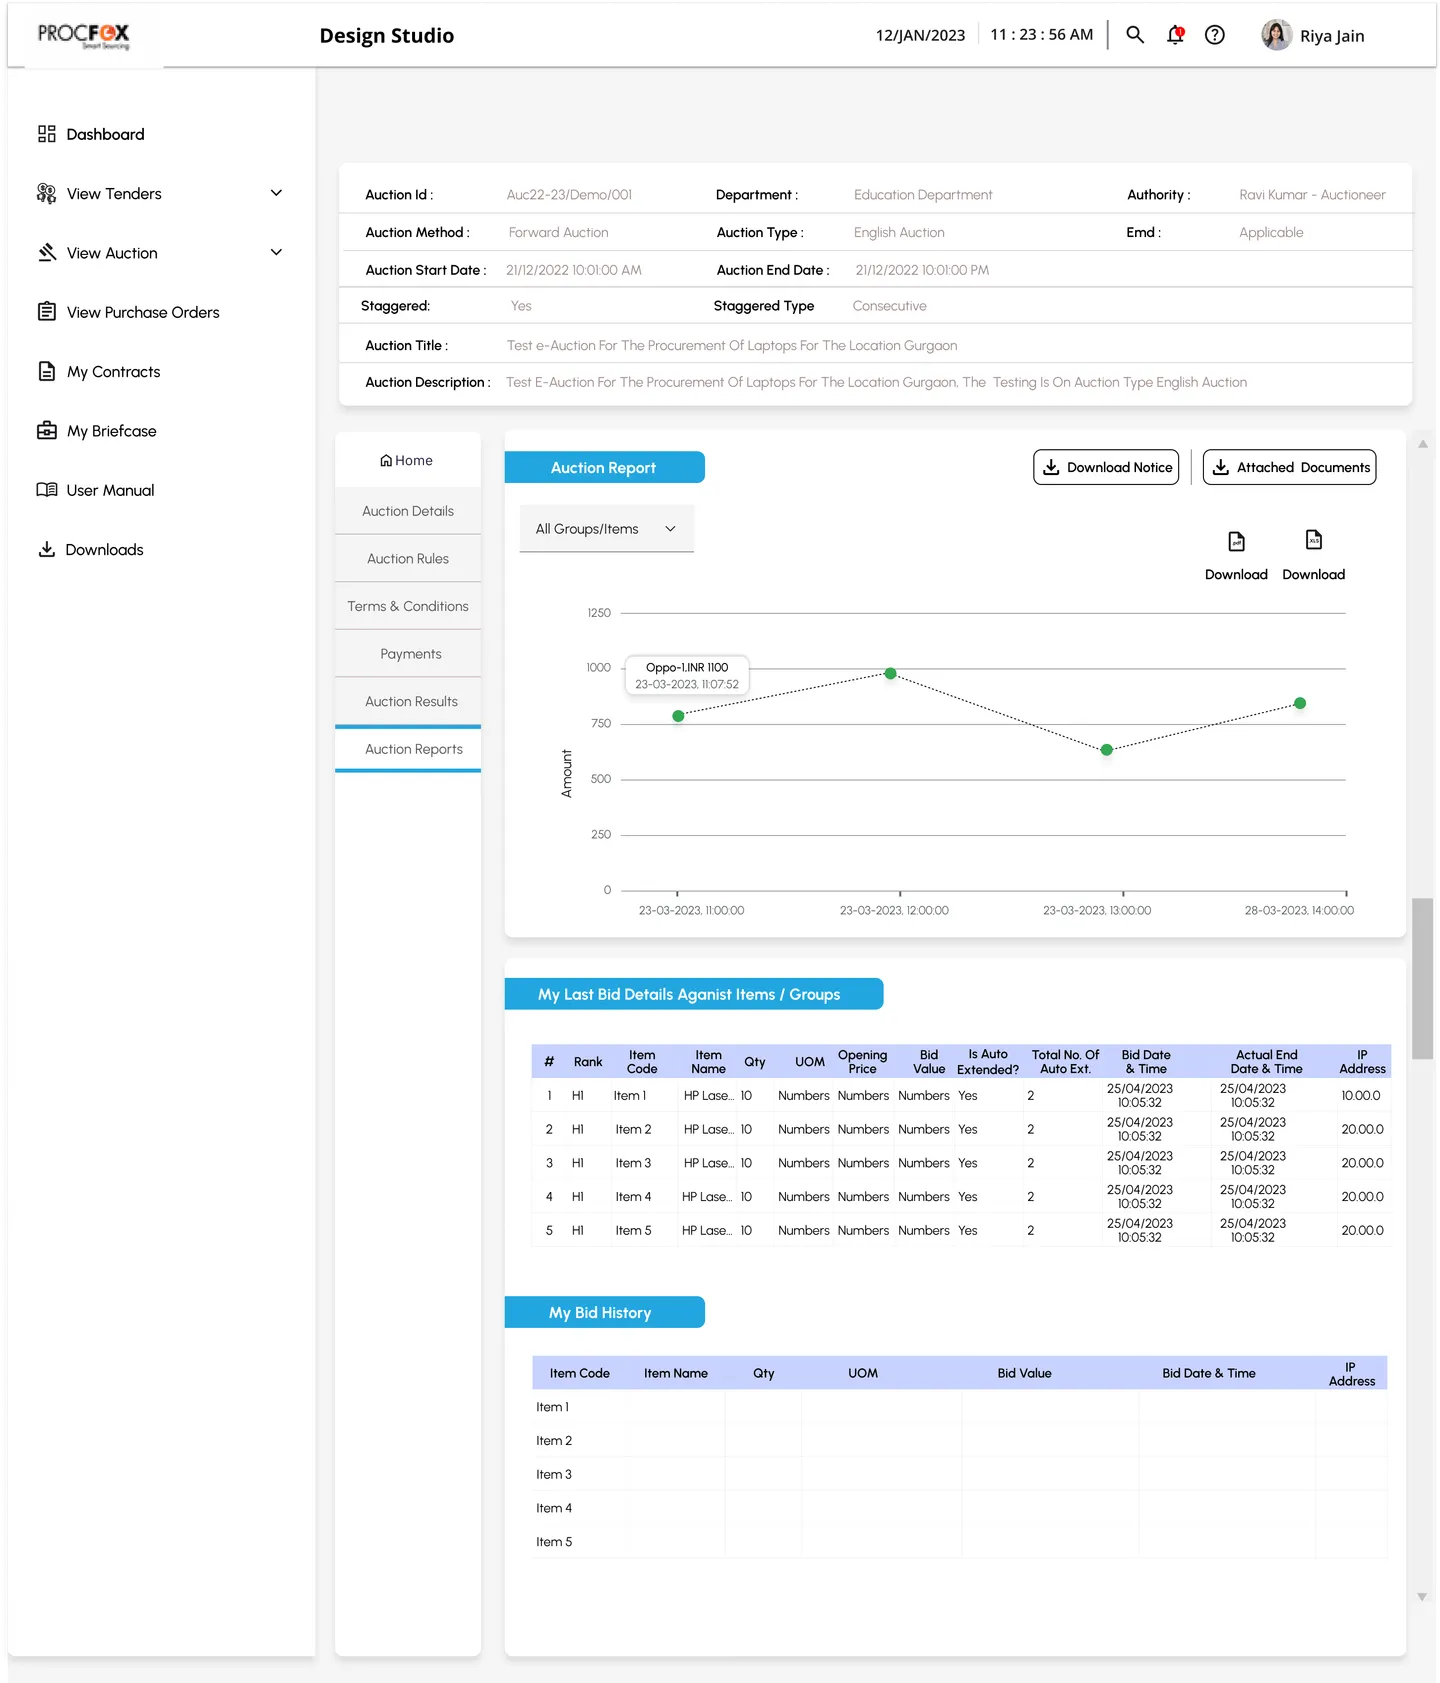
Supplier
Auction report
“How did my bids do?”
What to look for
- The same layout as the auctioneer’s report
- Only the supplier’s own last bids and bid history
- Rank shown for every item
Names, auctions and figures are sample data.
Three design decisions
Decision 01: Lead with what needs attention
Why: Auctioneers juggle many auctions at once. The dashboard should tell them where to look before they start reading.
The dashboard opens with counts and trends, then moves to the auctions themselves. Hover or tap the pins.
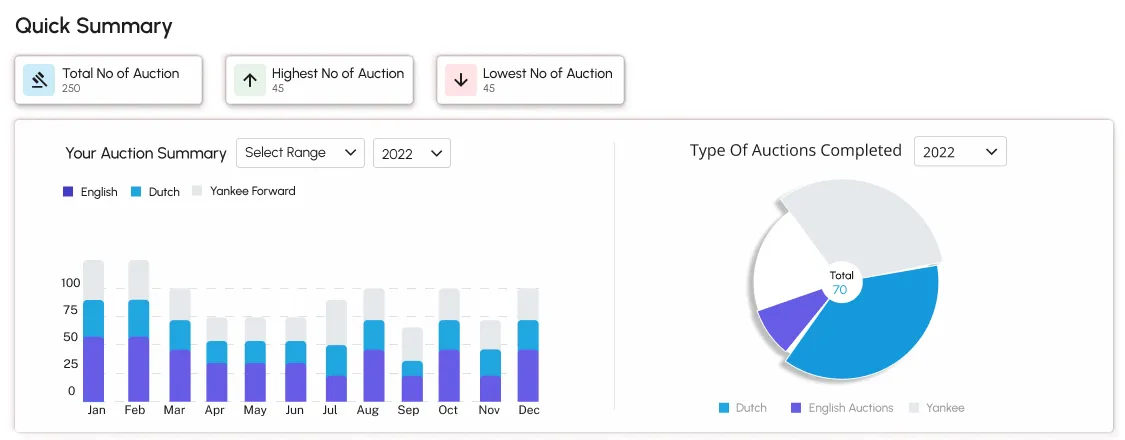
- 1
Three numbers first
Total, highest and lowest auction counts give the big picture before any detail.
- 2
Filters live on the chart
Range and year selectors sit inside the chart card, so changing them never reloads the page.
- 3
One colour per auction type
English, Dutch and Yankee keep the same colour in both charts, so they read as one story.
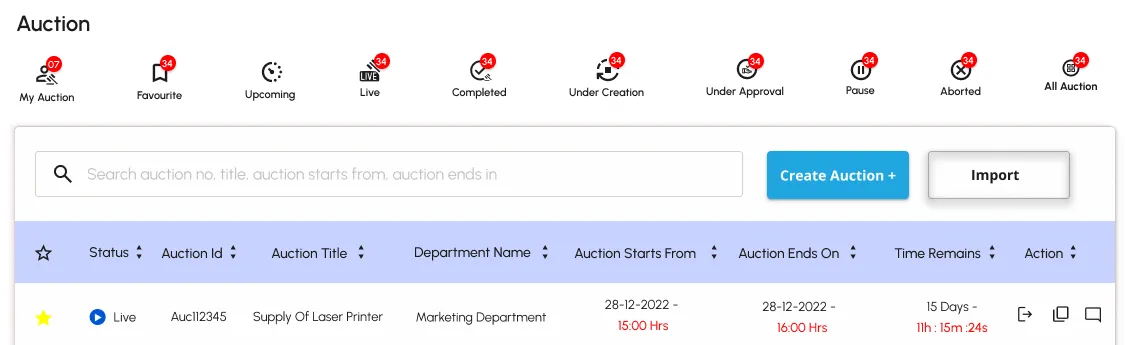
- 1
Every status, one tap, with a count
Red badges show how many auctions sit in each status, so a busy queue stands out straight away.
- 2
Search by what people remember
Auction number, title or dates, in one field.
- 3
One primary action
Create Auction is the only filled button. Import sits beside it as a secondary option.
- 4
Time in red
Start, end and remaining times are highlighted, because in an auction the clock is the most urgent fact.
The ten status filters map the whole life of an auction:
Under creation
Set-up in progress
Under approval
Waiting for sign-off
Upcoming
Approved and scheduled
Live
Suppliers bidding now
Completed
Results and reports ready
Pause · a live auction put on hold
Aborted · stopped before it finished
Plus shortcut views, not statuses: My auction Favourite All auction
Decision 02: Give every auction the same skeleton
Why: People move between dozens of auctions a day. If each one is laid out the same way, they never have to search.
Every auction screen shares one structure. The key facts (ID, department, authority, dates and title) sit in a card at the top. A chapter menu on the left (Home, details, rules, terms, payments, results, reports, bid history) stays in the same place. The content uses labelled sections.
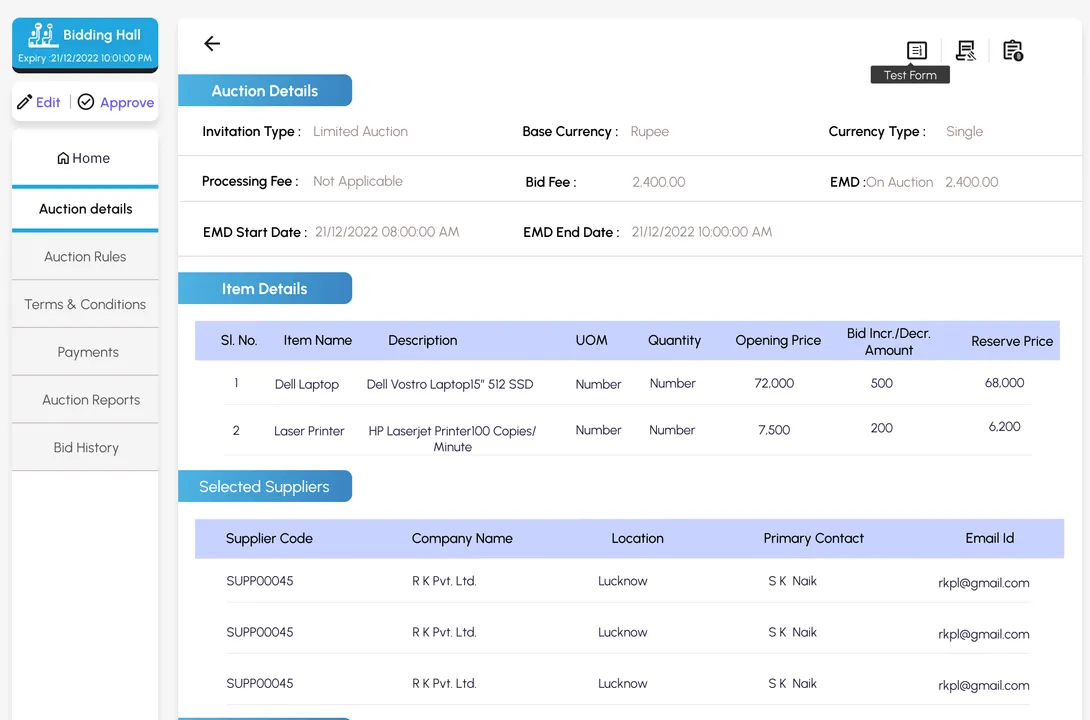
- 1
The live action, one click away
The Bidding Hall shows its expiry time and sits above everything else on the page.
- 2
Actions next to what they change
Edit and Approve sit right under the auction they apply to, not in a distant toolbar.
- 3
The same chapters every time
Every auction has the same menu, and the current chapter is underlined.
- 4
Labelled sections
Blue section labels break a long form into blocks: details, items, suppliers and documents.
- 5
Icons with names
Icon actions show a tooltip label, so nobody has to guess what they do.
Decision 03: Same auction, two sides
Why: The auctioneer needs everything. A supplier must only ever see their own bids.
The auction report uses one layout for both roles, so it is designed and built once. What changes is the data each role is allowed to see.
Auctioneer
Everything about the auction
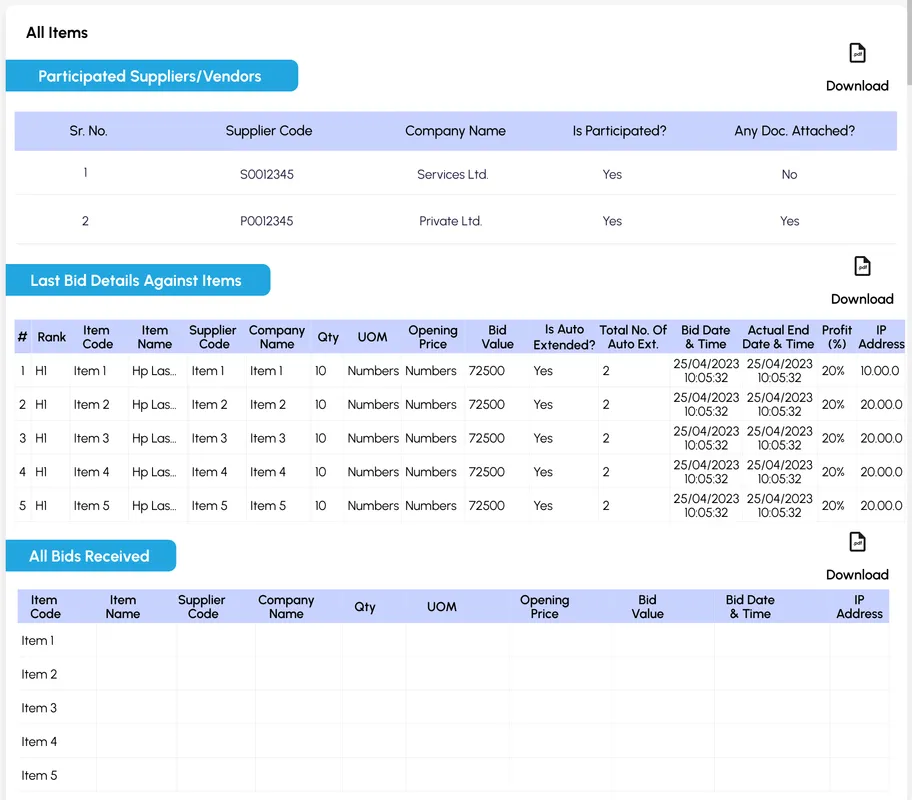
- Every participating supplier, and whether they attached documents
- Each supplier’s last bid, rank and profit on every item
- All bids received, ready to download
Supplier
Only my bids
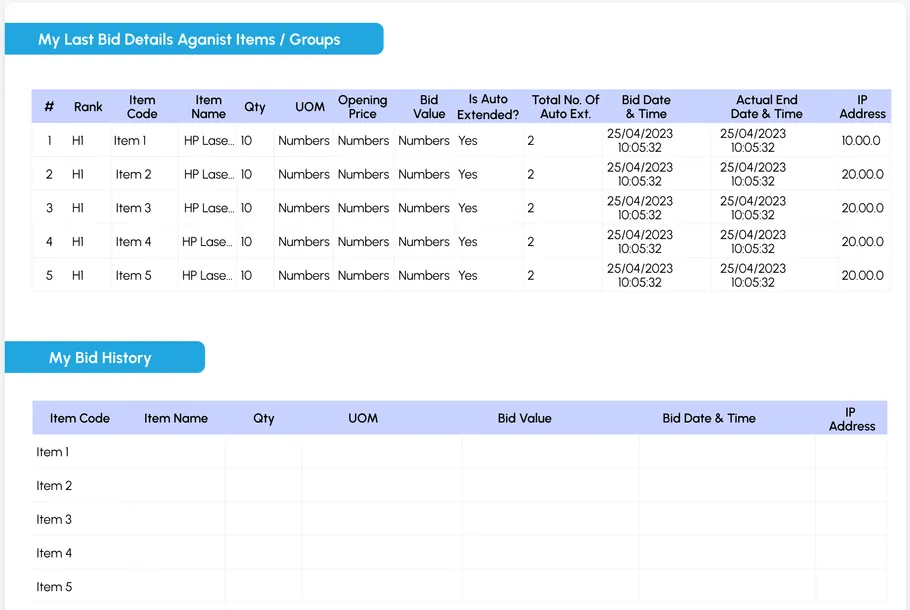
- Their own last bid and rank on each item
- Their own bid history
- No other supplier’s names or bids, ever
A design system and style guide
The auction module has dozens of screens, so I built a design system and documented it in a style guide. It covers the colour roles, type and the components every screen is built from. Developers could reuse the same parts instead of redrawing them, which kept every screen consistent. Here’s an excerpt, redrawn from the designs:
01 · Colour
Procfox blue
#21a6df
Primary actions, section labels
Table lavender
#c7d2ff
Table headers
Live blue
#0056d1
Live status
Chart indigo
#665be6
English auctions in charts
Alert red
#fc0e0e
Times, counts and alerts
Charcoal
#1e1c1d
Text and footer
02 · Type
- Page heading22px · MediumQuick Summary
- Section label16px · SemiboldAuction Details
- Table header14px · MediumAuction Starts From
- Body14px · RegularSupply of laser printer
- Field value14px · RegularEducation Department
03 · Components
Buttons
Section label
Auction DetailsStatus filter with count
Table header
Status & time
11h : 15m : 24s
Detail row
Auction Id :Auc22-23/Demo/001
Outcome
The redesigned workflows improved efficiency by 30%. The design system made new screens faster and more consistent to build, because each one reused the same parts.
What I learned
In B2B tools, the biggest wins come from removing steps, not adding features. Agreeing the structure in low fidelity, before anything was polished, meant feedback was about the workflow rather than the colours, and it saved rounds of rework later.